Two Must-Have Skills for Acing the ACT Science Test
 Of the four ACT tests, the science test is the one about which I hear the most complaints:
“It’s not even about science.”
“That’s not what I learned in science class.”
And you know what? You’re right. The ACT science test is much more about interpreting information supplied in the scenarios and much less about how much you can recall from your sophomore year biology class.
Though you will need to have a plethora of skills at your disposal if you’re going to ace the science test, in this post we are going to share two that are critical. Use these two skills to simplify what can seem like difficult tables and graphs.
By my count, 21 of the 40 items on the latest ACT science test (2016-2017 Preparing-for-the-ACT Booklet) required using either a table or a graph. Fourteen of those 21 required students to decipher a graph or two; seven made them interpret a table. So, you can see these two skills affect at least one-half of your science score.
The examples used in this post are from the released ACT contained in the 2016-2017 Preparing-for-the-ACT Guide and are the property of ACT Inc, not 36 University.
Let’s get right to it!
Dissect the Tables
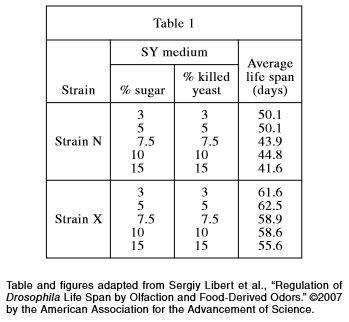
The ACT has a tendency to cram as much information as possible into a single table. This practice makes deciphering the tables difficult but crucial to maximizing your ACT score. Take a look:
36U Must-Have Skill #1
The first column tells you WHO the table is about. The rest of the columns tell you WHAT information you are going to get about each WHO.
I see the table like this:
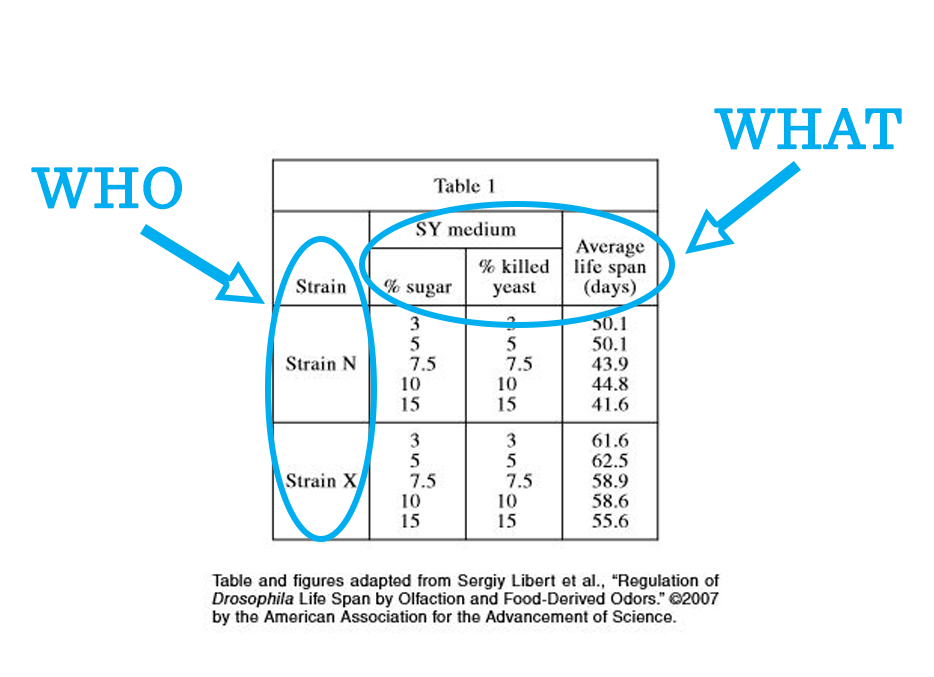
This table is about different strains of fruit fruits; that’s the WHO. The rest of the columns tell you about the % sugar, % killed yeast, and average life span; that’s the WHAT.
Let’s try a couple. Both of the questions can be answered from the table provided.
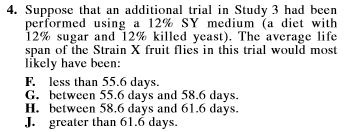
From the table, you should start in the Strain X row (WHO) and go over to the columns for % sugar and % killed yeast (WHAT). Twelve percent falls between 10% and 15%. Check the average life span column to estimate that the average life span would be between 55.6 and 58.6 days. Choose G.
Here’s another. You need to know that the text for this scenario tells you that Strain X fruit flies have impaired ability to detect odors. Strain N does not.
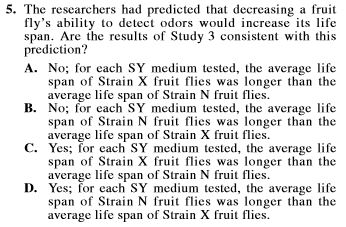
To answer this item, you’ll need the Strain X row and the Strain N row. Those are the WHO. From there, go to the column that is about average life span (WHAT). You can readily see that the average life span of Strain X fruit flies is longer than the life span of Strain N fruit flies. Choose C.
Disentangle the Graphs
Like the tables, the graphs are packed with data…
The ACT has no qualms placing multiple graphs on a single coordinate plane. Many times those extra graphs mean more horizontal and vertical axes, which makes interpreting the data even more difficult. Take your time: these graphs can be intimidating, but they are easily dissected.
36U Must-Have Skill #2
Find output values by tracing from the input value to the corresponding graph (use the key) and from there to the corresponding axis.
I’ll use an example from the same released ACT to show you what I mean:

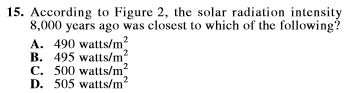
Use the tip. Start at 8,000 years ago and trace up to the solar radiation graph (from key: dashed line). Take a left, because the solar radiation graph is on the left. The answer is 500 watts per square meter.

Thanks for checking out our tips. If you like the tips presented, please check out our entire ACT Prep program at 36university.com.
I hope you’ll find these tips helpful on your next ACT.
-Kendal Shipley, Ed.D.
12/9/2016
More 36U Resources: