Your Week-Before-the-ACT Game Plan (Part 4 of 4: Science)
This is the final installment of our week-before-the-ACT game plan. Let us know how your game plan works on the big test!

The Setup
It’s nice to finish off the ACT with another shorter test. The Science Test, like the preceding Reading Test, will give you 40 minutes to answer 35 items. Those 35 items will be spread over 6 to 7 scenarios.
The Tables Have So Many Rows and Columns
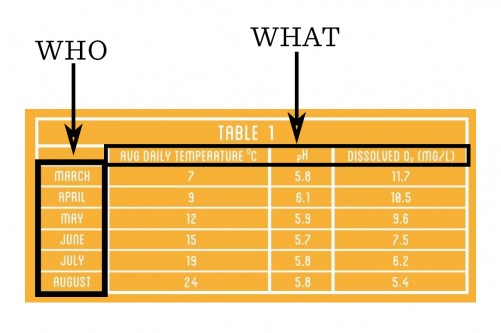
Do you need to be reminded how complicated ACT Science tables can get? ACT is an expert at packing a ton of info into a single table. And the more information they put in a table, the more confusing and intimidating the table is likely to be.
Use one simple principle to read the tables efficiently: the first column almost always tells you WHO the table is about, and the rest of the columns tell you WHAT they are going to tell you about the WHO. Take the table below, for instance. The table is about different months. For each of those months, the table gives you the temperature, the pH, and the dissolved oxygen reading. This principle works no matter how difficult the table becomes.
And The Graphs Have So Many Plots and So Many Axes
Do they have to display so many relationships on a single graph? Along with multiple graphed relationships, you are often given multiple x- and y-axes. Yes, the graphs can get complicated in a hurry. Your ability to locate relevant information and interpret it will be crucial. Follow these two steps to simplify the process:
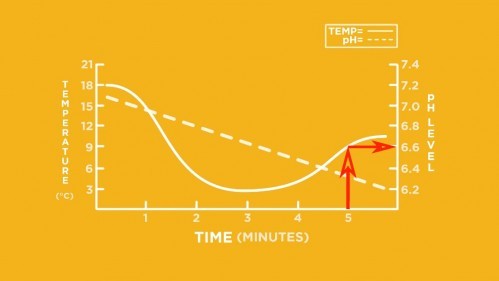
- Use the key to figure out which graph corresponds with which axis. In the graph below, you see the solid temperature graph corresponds with the axis on the left, and the dashed pH graph corresponds with the axis at the right.
- Be prepared to trace lines to find specific values. Can you find the pH level at the 5-minute mark? Start at the 5-minute mark and draw a line up to the solid pH line. From there, trace right to the pH axis. The pH is about 6.6.
What About the Text-Only Passage?
The Conflicting Viewpoints scenario will be the only scenario comprised of only text. Several viewpoints will be presented. As you read the viewpoints, underline key details from each, making sure to note how they differ. You will be asked to differentiate between the perspectives.
A Game Plan
Read the introductory text of each scenario carefully. The text is used to explain the setting of the research or experiments. Understanding the setting is often critical to interpreting the tables and graphs correctly.
For each table, identify WHO the table is about and WHAT they are going to tell you about the WHOs. For graphs, note the input axis label (horizontal axis) and the output axis label (vertical axis) and check to see if there is a key. You will not likely need to spend any significant time reading the tables and graphs before you get to the questions. Use the questions to tell you where to focus on the tables and graphs.
Many of the more difficult items will require you to synthesize information from several pieces of the scenario. Information found in the text may be key to understanding a table. Data from two graphs may be required to answer a single item. Many times, these difficult items are found in the final few questions of a scenario.
Recent Posts:
Your Week-Before-the-ACT Game Plan (Part 3 of 4: Reading)