
Conic Sections – Outschool
Conic Sections: Circles Lesson
I. Basic Equation
When graphed, the solutions of second degree equations in two variables form conic sections, like circles, ellipses, and hyperbolas. For the ACT, we’ll focus on the equations of circles.
The solutions to the equation [latex] (x-h)^2 + (y-k)^2 = r^2 [/latex] form a circle that has a center at (h,k) and a radius of length r.
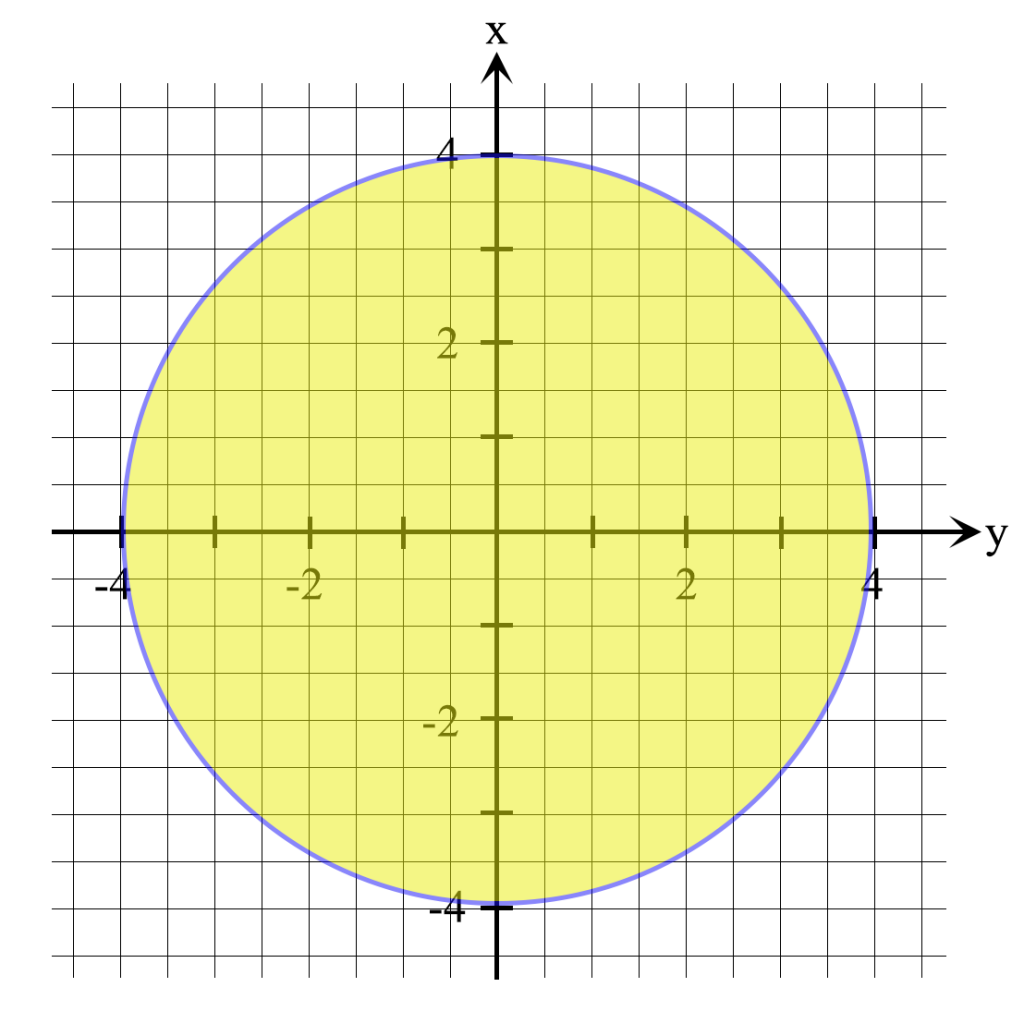
Equation: [latex] x^2 +y^2 = 16 [/latex]
When graphed, the solutions to this equation form a circle.
Shape: Circle
Center: (0, 0)
Radius: 4 (take the square root of 16)
Graph:
II. Translating the Circle Left/Right and Up/Down
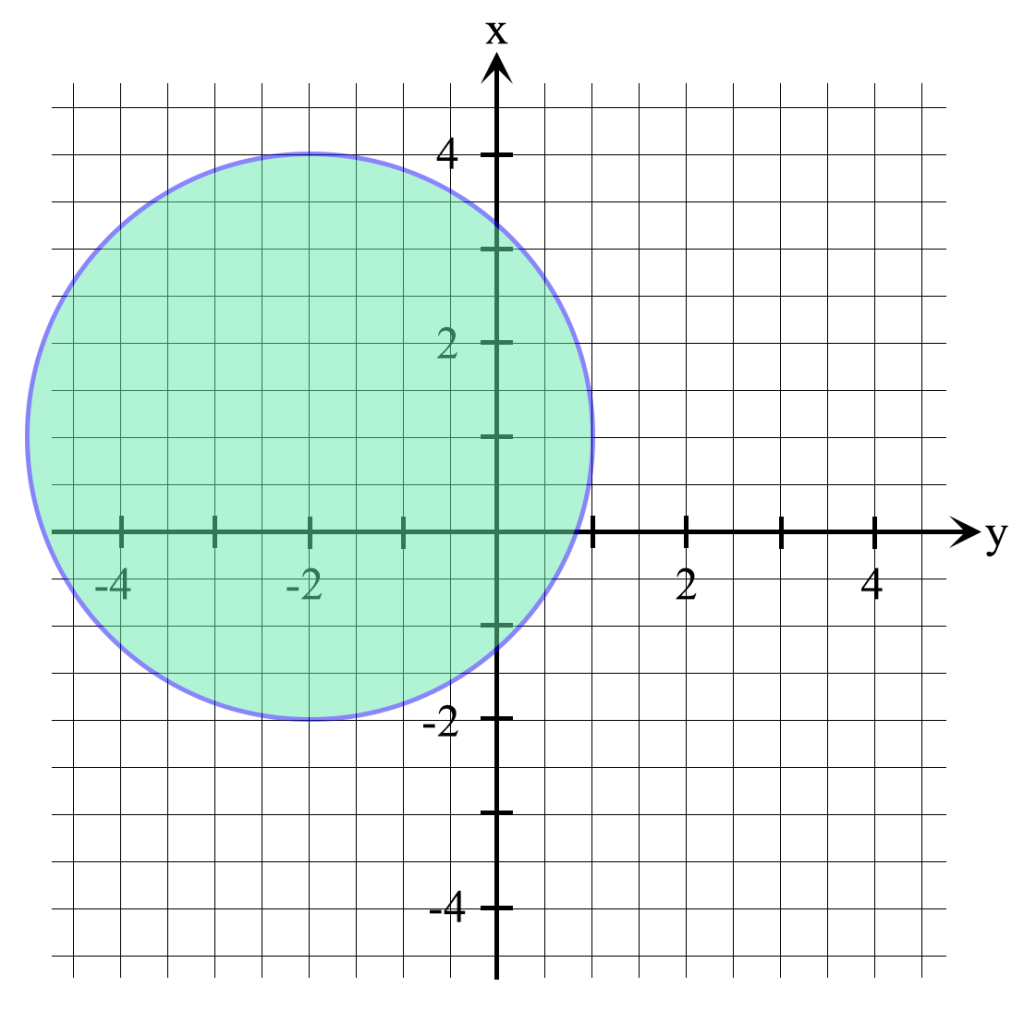
Equation: [latex] (x+2)^2 + (y-1)^2 = 9 [/latex]
Center: (-2,1) (The center coordinates have opposite signs from those in the equation.)
Radius: 3 (Take the square root of 9.)
Graph:
III. From Graph to Equation
Ex. Write an equation for the circle.
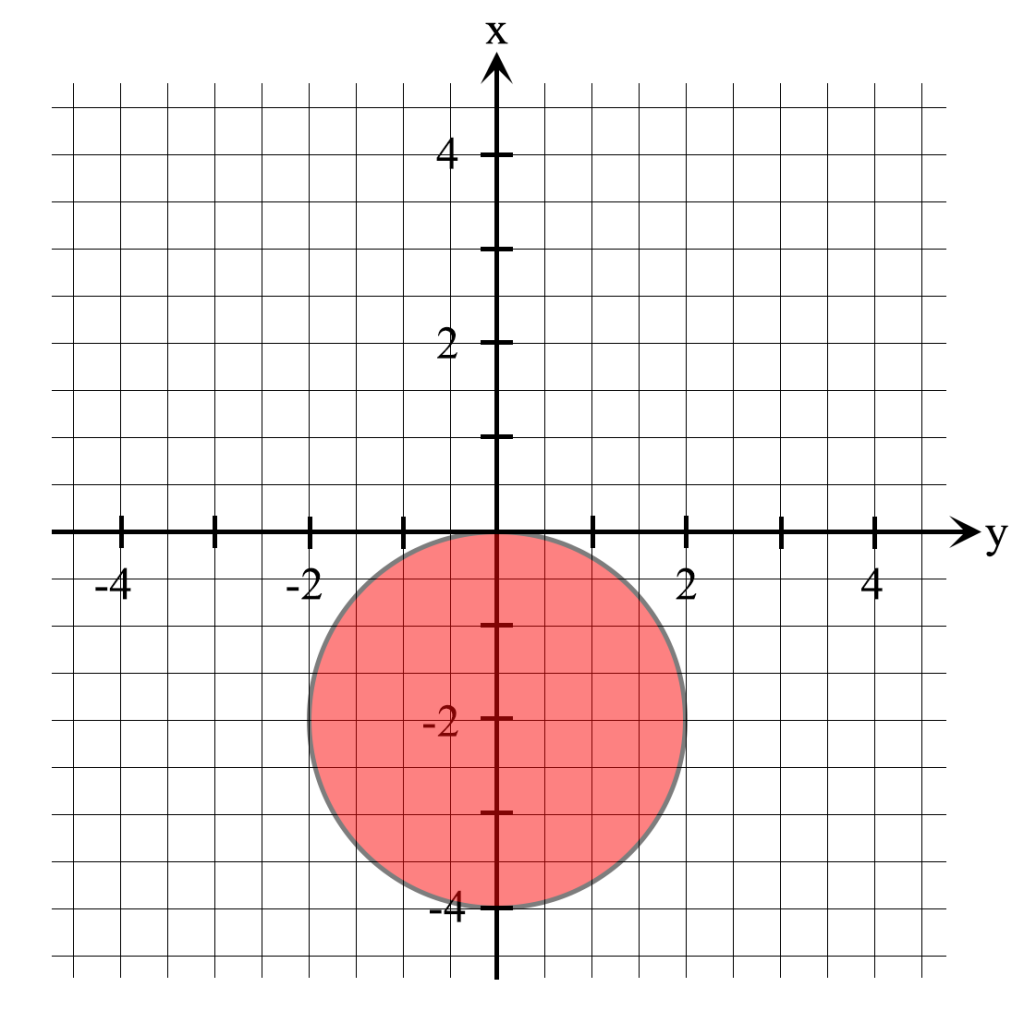
Step 1: Find the circle’s center.
Center: (0,-2)
Step 2: Find the circle’s radius.
Radius = 2
Step 3: Substitute into [latex] (x-h)^2 + (y-k)^2 = r^2 [/latex] .
Equation: [latex] x^2 + (y+2)^2 = 4 [/latex]