
ACT Science Final Quiz 1 – Outschool
ACT Science Final Quiz 1
You will be given 6 minutes to complete this 6-question science passage. Good luck!
Quiz Summary
0 of 6 Questions completed
Questions:
Information
You have already completed the quiz before. Hence you can not start it again.
Quiz is loading…
You must sign in or sign up to start the quiz.
You must first complete the following:
Results
Results
0 of 6 Questions answered correctly
Your time:
Time has elapsed
You have reached 0 of 0 point(s), (0)
Earned Point(s): 0 of 0, (0)
0 Essay(s) Pending (Possible Point(s): 0)
Categories
- Not categorized 0%
- 1
- 2
- 3
- 4
- 5
- 6
- Current
- Review / Skip
- Answered
- Correct
- Incorrect
-
Question 1 of 6
1. Question
Acid-base titration is a technique in which precise volumes of a titrant (an acid or base solution) are added incrementally to a known volume of a sample solution (a base or acid solution, respectively).
In acid-base titration experiments, equivalence points are reached when the amounts of base and acid in the solution are chemically equivalent. On acid-base titration graphs, equivalence points are characterized by a relatively large change in pH over a relatively small change in titrant volume.
Two titration experiments were performed at 25oC. In both experiments, a 0.10 M sodium hydroxide (NaOH) solution was used to titrate an acidic solution. All solutions were aqueous.
Experiment 1
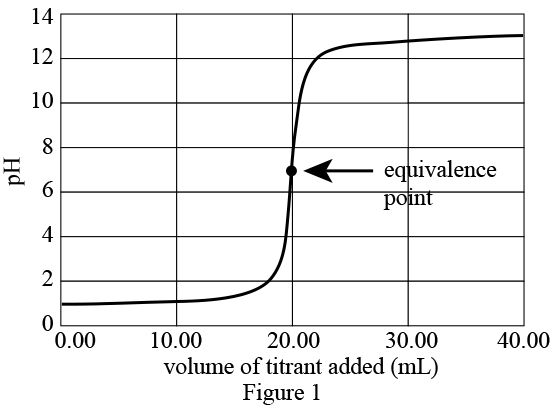
A 0.10 M NaOH solution was slowly added to 200 mL of a 0.01 M hydrochloric acid (HCl) solution. After each addition of NaOH, the solution was stirred and the pH measured using a pH meter and recorded. See Figure 1.
Experiment 2
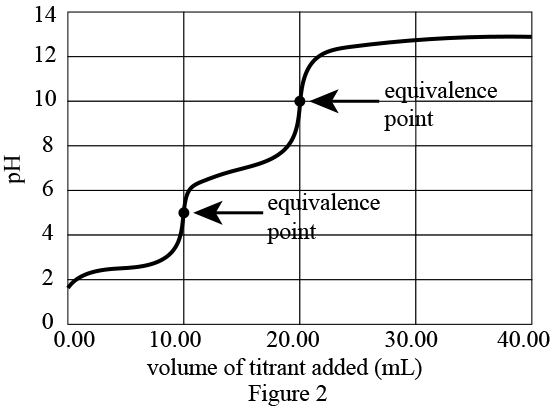
Experiment 1 was repeated, except 0.10 M NaOH was added to 25 mL of an unknown acidic solution. The titration curve is displayed in Figure 2.
In Experiment 1, which of the following best describes the pH of the solution after 25 mL of sodium hydroxide had been added?
CorrectIncorrectHint
Use Figure 1.
Start at 25 mL on the horizontal axis. Trace a line up to the curve and left to the vertical axis.
-
Question 2 of 6
2. Question
Acid-base titration is a technique in which precise volumes of a titrant (an acid or base solution) are added incrementally to a known volume of a sample solution (a base or acid solution, respectively).
In acid-base titration experiments, equivalence points are reached when the amounts of base and acid in the solution are chemically equivalent. On acid-base titration graphs, equivalence points are characterized by a relatively large change in pH over a relatively small change in titrant volume.
Two titration experiments were performed at 25oC. In both experiments, a 0.10 M sodium hydroxide (NaOH) solution was used to titrate an acidic solution. All solutions were aqueous.
Experiment 1
A 0.10 M NaOH solution was slowly added to 200 mL of a 0.01 M hydrochloric acid (HCl) solution. After each addition of NaOH, the solution was stirred and the pH measured using a pH meter and recorded. See Figure 1.
Experiment 2
Experiment 1 was repeated, except 0.10 M NaOH was added to 25 mL of an unknown acidic solution. The titration curve is displayed in Figure 2.
In Experiment 1, the sample solution was neutral at which of the following volumes of the titrant?
CorrectIncorrectHint
When the pH = 7, the solution is neutral.
-
Question 3 of 6
3. Question
Acid-base titration is a technique in which precise volumes of a titrant (an acid or base solution) are added incrementally to a known volume of a sample solution (a base or acid solution, respectively).
In acid-base titration experiments, equivalence points are reached when the amounts of base and acid in the solution are chemically equivalent. On acid-base titration graphs, equivalence points are characterized by a relatively large change in pH over a relatively small change in titrant volume.
Two titration experiments were performed at 25oC. In both experiments, a 0.10 M sodium hydroxide (NaOH) solution was used to titrate an acidic solution. All solutions were aqueous.
Experiment 1
A 0.10 M NaOH solution was slowly added to 200 mL of a 0.01 M hydrochloric acid (HCl) solution. After each addition of NaOH, the solution was stirred and the pH measured using a pH meter and recorded. See Figure 1.
Experiment 2
Experiment 1 was repeated, except 0.10 M NaOH was added to 25 mL of an unknown acidic solution. The titration curve is displayed in Figure 2.
Acid-base indicators are substances which change colors over certain pH ranges. The colors of four acid-base indicators over a range of pH values are shown in the table below (B = blue, G = green, P = purple, O = orange, R = red, Y = yellow).
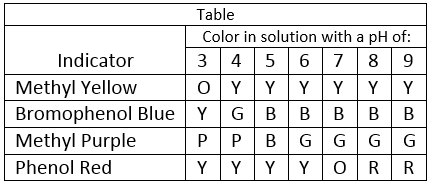
A student wants to use an acid-base indicator to identify the equivalence point from Experiment 1. Which of the following indicators should she use?
CorrectIncorrectHint
Use Figure 1 to determine the equivalence point has a pH of 7.
-
Question 4 of 6
4. Question
Acid-base titration is a technique in which precise volumes of a titrant (an acid or base solution) are added incrementally to a known volume of a sample solution (a base or acid solution, respectively).
In acid-base titration experiments, equivalence points are reached when the amounts of base and acid in the solution are chemically equivalent. On acid-base titration graphs, equivalence points are characterized by a relatively large change in pH over a relatively small change in titrant volume.
Two titration experiments were performed at 25oC. In both experiments, a 0.10 M sodium hydroxide (NaOH) solution was used to titrate an acidic solution. All solutions were aqueous.
Experiment 1
A 0.10 M NaOH solution was slowly added to 200 mL of a 0.01 M hydrochloric acid (HCl) solution. After each addition of NaOH, the solution was stirred and the pH measured using a pH meter and recorded. See Figure 1.
Experiment 2
Experiment 1 was repeated, except 0.10 M NaOH was added to 25 mL of an unknown acidic solution. The titration curve is displayed in Figure 2.
In Experiment 2, the solution’s pH increased the most over which of the following sodium hydroxide volume ranges?
CorrectIncorrectHint
Compare pH changes over each of the given ranges.
-
Question 5 of 6
5. Question
Acid-base titration is a technique in which precise volumes of a titrant (an acid or base solution) are added incrementally to a known volume of a sample solution (a base or acid solution, respectively).
In acid-base titration experiments, equivalence points are reached when the amounts of base and acid in the solution are chemically equivalent. On acid-base titration graphs, equivalence points are characterized by a relatively large change in pH over a relatively small change in titrant volume.
Two titration experiments were performed at 25oC. In both experiments, a 0.10 M sodium hydroxide (NaOH) solution was used to titrate an acidic solution. All solutions were aqueous.
Experiment 1
A 0.10 M NaOH solution was slowly added to 200 mL of a 0.01 M hydrochloric acid (HCl) solution. After each addition of NaOH, the solution was stirred and the pH measured using a pH meter and recorded. See Figure 1.
Experiment 2
Experiment 1 was repeated, except 0.10 M NaOH was added to 25 mL of an unknown acidic solution. The titration curve is displayed in Figure 2.
If a 0.20 M solution of sodium hydroxide had been used as the titrant in Experiment 2, how many milliliters of sodium hydroxide would need to be present in the solution for the pH to be 10?
CorrectIncorrectHint
In Experiment 2, 20 mL of 0.10 M NaoH were added to the solution to reach a pH of 10.
-
Question 6 of 6
6. Question
Acid-base titration is a technique in which precise volumes of a titrant (an acid or base solution) are added incrementally to a known volume of a sample solution (a base or acid solution, respectively).
In acid-base titration experiments, equivalence points are reached when the amounts of base and acid in the solution are chemically equivalent. On acid-base titration graphs, equivalence points are characterized by a relatively large change in pH over a relatively small change in titrant volume.
Two titration experiments were performed at 25oC. In both experiments, a 0.10 M sodium hydroxide (NaOH) solution was used to titrate an acidic solution. All solutions were aqueous.
Experiment 1
A 0.10 M NaOH solution was slowly added to 200 mL of a 0.01 M hydrochloric acid (HCl) solution. After each addition of NaOH, the solution was stirred and the pH measured using a pH meter and recorded. See Figure 1.
Experiment 2
Experiment 1 was repeated, except 0.10 M NaOH was added to 25 mL of an unknown acidic solution. The titration curve is displayed in Figure 2.
When acids are titrated by bases of equivalent strength, their equivalence point has a pH of 7. If the acid is stronger than the base, the equivalence point will be less than 7. If the base is stronger than the acid, the equivalence point will be greater than 7. Which of the following graphs best depicts the titration of a weak acid by a strong base?
CorrectIncorrectHint
From the graphs in Figures 1 and 2, infer that equivalence points occur in the middle of sharp pH increases.