
Science Practice Test 2 (Timed)
Quiz Summary
0 of 40 Questions completed
Questions:
Information
You have already completed the quiz before. Hence you can not start it again.
Quiz is loading…
You must sign in or sign up to start the quiz.
You must first complete the following:
Results
Results
0 of 40 Questions answered correctly
Your time:
Time has elapsed
You have reached 0 of 0 point(s), (0)
Earned Point(s): 0 of 0, (0)
0 Essay(s) Pending (Possible Point(s): 0)
Categories
- Not categorized 0%
- 1
- 2
- 3
- 4
- 5
- 6
- 7
- 8
- 9
- 10
- 11
- 12
- 13
- 14
- 15
- 16
- 17
- 18
- 19
- 20
- 21
- 22
- 23
- 24
- 25
- 26
- 27
- 28
- 29
- 30
- 31
- 32
- 33
- 34
- 35
- 36
- 37
- 38
- 39
- 40
- Current
- Review
- Answered
- Correct
- Incorrect
-
Question 1 of 40
1. Question
Item 1
In coordination chemistry, the stability of a transition metal complex depends on several factors, including the identity of the central metal ion, the nature of the ligands, and environmental conditions such as temperature and pH. One important concept used to evaluate complex stability is the formation constant (Kₙ), which quantifies the equilibrium between a metal ion and its ligands in solution. Larger Kₙ values indicate more stable complexes. Researchers have proposed that both ligand denticity (the number of donor atoms in a ligand) and ligand geometry significantly influence complex stability through the chelate effect and steric interactions.
Two research groups conducted experiments to investigate how ligand structure affects the stability of complexes formed with copper(II) ions (Cu²⁺) in aqueous solution.
Experiment 1
A group of researchers examined three ligands:
- Ligand A: a monodentate ligand (1 donor atom)
- Ligand B: a bidentate ligand (2 donor atoms)
- Ligand C: a tetradentate ligand (4 donor atoms)
Each ligand was added separately to identical Cu²⁺ solutions at 25°C and neutral pH. The formation constant (log Kₙ) for each resulting complex was measured.
Table 1.
Ligand log Kₙ A 4.2 B 8.7 C 15.3 Experiment 2
A second group investigated how ligand geometry and rigidity affect stability. Two bidentate ligands were studied:
- Ligand D: a flexible ligand with a wide range of bond angles
- Ligand E: a rigid ligand with a fixed bond angle optimized for Cu²⁺ coordination
Both ligands were added to Cu²⁺ solutions under the same conditions as Experiment 1. Formation constants were measured at two temperatures: 25°C and 50°C.
Table 2.
Ligand Temperature (°C) log Kₙ D 25 7.9 D 50 6.5 E 25 10.2 E 50 9.8 Based on the results of Experiment 1, which of the following statements best explains the increase in log Kₙ from Ligand A to Ligand C?
CorrectIncorrect -
Question 2 of 40
2. Question
Item 2
In coordination chemistry, the stability of a transition metal complex depends on several factors, including the identity of the central metal ion, the nature of the ligands, and environmental conditions such as temperature and pH. One important concept used to evaluate complex stability is the formation constant (Kₙ), which quantifies the equilibrium between a metal ion and its ligands in solution. Larger Kₙ values indicate more stable complexes. Researchers have proposed that both ligand denticity (the number of donor atoms in a ligand) and ligand geometry significantly influence complex stability through the chelate effect and steric interactions.
Two research groups conducted experiments to investigate how ligand structure affects the stability of complexes formed with copper(II) ions (Cu²⁺) in aqueous solution.
Experiment 1
A group of researchers examined three ligands:
- Ligand A: a monodentate ligand (1 donor atom)
- Ligand B: a bidentate ligand (2 donor atoms)
- Ligand C: a tetradentate ligand (4 donor atoms)
Each ligand was added separately to identical Cu²⁺ solutions at 25°C and neutral pH. The formation constant (log Kₙ) for each resulting complex was measured.
Table 1.
Ligand log Kₙ A 4.2 B 8.7 C 15.3 Experiment 2
A second group investigated how ligand geometry and rigidity affect stability. Two bidentate ligands were studied:
- Ligand D: a flexible ligand with a wide range of bond angles
- Ligand E: a rigid ligand with a fixed bond angle optimized for Cu²⁺ coordination
Both ligands were added to Cu²⁺ solutions under the same conditions as Experiment 1. Formation constants were measured at two temperatures: 25°C and 50°C.
Table 2.
Ligand Temperature (°C) log Kₙ D 25 7.9 D 50 6.5 E 25 10.2 E 50 9.8 A researcher proposes a new tridentate ligand, Ligand F. Based on Experiment 1, the log Kₙ for Ligand F would most likely be:
CorrectIncorrect -
Question 3 of 40
3. Question
Item 3
In coordination chemistry, the stability of a transition metal complex depends on several factors, including the identity of the central metal ion, the nature of the ligands, and environmental conditions such as temperature and pH. One important concept used to evaluate complex stability is the formation constant (Kₙ), which quantifies the equilibrium between a metal ion and its ligands in solution. Larger Kₙ values indicate more stable complexes. Researchers have proposed that both ligand denticity (the number of donor atoms in a ligand) and ligand geometry significantly influence complex stability through the chelate effect and steric interactions.
Two research groups conducted experiments to investigate how ligand structure affects the stability of complexes formed with copper(II) ions (Cu²⁺) in aqueous solution.
Experiment 1
A group of researchers examined three ligands:
- Ligand A: a monodentate ligand (1 donor atom)
- Ligand B: a bidentate ligand (2 donor atoms)
- Ligand C: a tetradentate ligand (4 donor atoms)
Each ligand was added separately to identical Cu²⁺ solutions at 25°C and neutral pH. The formation constant (log Kₙ) for each resulting complex was measured.
Table 1.
Ligand log Kₙ A 4.2 B 8.7 C 15.3 Experiment 2
A second group investigated how ligand geometry and rigidity affect stability. Two bidentate ligands were studied:
- Ligand D: a flexible ligand with a wide range of bond angles
- Ligand E: a rigid ligand with a fixed bond angle optimized for Cu²⁺ coordination
Both ligands were added to Cu²⁺ solutions under the same conditions as Experiment 1. Formation constants were measured at two temperatures: 25°C and 50°C.
Table 2.
Ligand Temperature (°C) log Kₙ D 25 7.9 D 50 6.5 E 25 10.2 E 50 9.8 Which of the following conclusions about temperature effects is best supported by the data in Experiment 2?
CorrectIncorrect -
Question 4 of 40
4. Question
Item 4
In coordination chemistry, the stability of a transition metal complex depends on several factors, including the identity of the central metal ion, the nature of the ligands, and environmental conditions such as temperature and pH. One important concept used to evaluate complex stability is the formation constant (Kₙ), which quantifies the equilibrium between a metal ion and its ligands in solution. Larger Kₙ values indicate more stable complexes. Researchers have proposed that both ligand denticity (the number of donor atoms in a ligand) and ligand geometry significantly influence complex stability through the chelate effect and steric interactions.
Two research groups conducted experiments to investigate how ligand structure affects the stability of complexes formed with copper(II) ions (Cu²⁺) in aqueous solution.
Experiment 1
A group of researchers examined three ligands:
- Ligand A: a monodentate ligand (1 donor atom)
- Ligand B: a bidentate ligand (2 donor atoms)
- Ligand C: a tetradentate ligand (4 donor atoms)
Each ligand was added separately to identical Cu²⁺ solutions at 25°C and neutral pH. The formation constant (log Kₙ) for each resulting complex was measured.
Table 1.
Ligand log Kₙ A 4.2 B 8.7 C 15.3 Experiment 2
A second group investigated how ligand geometry and rigidity affect stability. Two bidentate ligands were studied:
- Ligand D: a flexible ligand with a wide range of bond angles
- Ligand E: a rigid ligand with a fixed bond angle optimized for Cu²⁺ coordination
Both ligands were added to Cu²⁺ solutions under the same conditions as Experiment 1. Formation constants were measured at two temperatures: 25°C and 50°C.
Table 2.
Ligand Temperature (°C) log Kₙ D 25 7.9 D 50 6.5 E 25 10.2 E 50 9.8 Which of the following ligands would most likely form the most stable complex with Cu²⁺ at 25°C?
CorrectIncorrect -
Question 5 of 40
5. Question
Item 5
In coordination chemistry, the stability of a transition metal complex depends on several factors, including the identity of the central metal ion, the nature of the ligands, and environmental conditions such as temperature and pH. One important concept used to evaluate complex stability is the formation constant (Kₙ), which quantifies the equilibrium between a metal ion and its ligands in solution. Larger Kₙ values indicate more stable complexes. Researchers have proposed that both ligand denticity (the number of donor atoms in a ligand) and ligand geometry significantly influence complex stability through the chelate effect and steric interactions.
Two research groups conducted experiments to investigate how ligand structure affects the stability of complexes formed with copper(II) ions (Cu²⁺) in aqueous solution.
Experiment 1
A group of researchers examined three ligands:
- Ligand A: a monodentate ligand (1 donor atom)
- Ligand B: a bidentate ligand (2 donor atoms)
- Ligand C: a tetradentate ligand (4 donor atoms)
Each ligand was added separately to identical Cu²⁺ solutions at 25°C and neutral pH. The formation constant (log Kₙ) for each resulting complex was measured.
Table 1.
Ligand log Kₙ A 4.2 B 8.7 C 15.3 Experiment 2
A second group investigated how ligand geometry and rigidity affect stability. Two bidentate ligands were studied:
- Ligand D: a flexible ligand with a wide range of bond angles
- Ligand E: a rigid ligand with a fixed bond angle optimized for Cu²⁺ coordination
Both ligands were added to Cu²⁺ solutions under the same conditions as Experiment 1. Formation constants were measured at two temperatures: 25°C and 50°C.
Table 2.
Ligand Temperature (°C) log Kₙ D 25 7.9 D 50 6.5 E 25 10.2 E 50 9.8 The difference in log Kₙ values between Ligands D and E at 25°C is most likely due to differences in:
CorrectIncorrect -
Question 6 of 40
6. Question
Item 6
In coordination chemistry, the stability of a transition metal complex depends on several factors, including the identity of the central metal ion, the nature of the ligands, and environmental conditions such as temperature and pH. One important concept used to evaluate complex stability is the formation constant (Kₙ), which quantifies the equilibrium between a metal ion and its ligands in solution. Larger Kₙ values indicate more stable complexes. Researchers have proposed that both ligand denticity (the number of donor atoms in a ligand) and ligand geometry significantly influence complex stability through the chelate effect and steric interactions.
Two research groups conducted experiments to investigate how ligand structure affects the stability of complexes formed with copper(II) ions (Cu²⁺) in aqueous solution.
Experiment 1
A group of researchers examined three ligands:
- Ligand A: a monodentate ligand (1 donor atom)
- Ligand B: a bidentate ligand (2 donor atoms)
- Ligand C: a tetradentate ligand (4 donor atoms)
Each ligand was added separately to identical Cu²⁺ solutions at 25°C and neutral pH. The formation constant (log Kₙ) for each resulting complex was measured.
Table 1.
Ligand log Kₙ A 4.2 B 8.7 C 15.3 Experiment 2
A second group investigated how ligand geometry and rigidity affect stability. Two bidentate ligands were studied:
- Ligand D: a flexible ligand with a wide range of bond angles
- Ligand E: a rigid ligand with a fixed bond angle optimized for Cu²⁺ coordination
Both ligands were added to Cu²⁺ solutions under the same conditions as Experiment 1. Formation constants were measured at two temperatures: 25°C and 50°C.
Table 2.
Ligand Temperature (°C) log Kₙ D 25 7.9 D 50 6.5 E 25 10.2 E 50 9.8 If a graph were constructed showing percent of Cu²⁺ bound in complex vs. log Kₙ at 25oC, which of the following trends would most likely be observed?
CorrectIncorrect -
Question 7 of 40
7. Question
Item 7
Efficient cooling of compact electronic devices requires careful optimization of multiple design variables. In forced-convection systems, heat is removed from a central processing unit (CPU) using a heat sink and airflow generated by a fan. The effectiveness of such systems depends on heat sink surface area, fin density (number of fins per unit width), and airflow rate.
While increasing surface area and airflow generally improves cooling, higher fin density can restrict airflow, and increased airflow requires greater energy consumption. Engineers must therefore balance these competing factors to achieve optimal performance.
Three engineering teams conducted experiments to evaluate these variables for a CPU operating at constant power.
Experiment 1
Team 1 investigated the combined effects of surface area and fin density on CPU temperature at a constant airflow rate of 2.0 m/s. Table 1 shows the CPU temperature (oC) at each surface area and fin density.
Table 1.
Surface Area (cm²) Low Fin Density Medium Fin Density High Fin Density 100 68 64 66 150 63 60 62 200 60 58 59 Experiment 2
Team 2 measured the effect of airflow rate on both temperature and fan power consumption using a heat sink with 150 cm² surface area and medium fin density. The results are displayed in Table 2.
Table 2.
Airflow (m/s) CPU Temperature (oC) Fan Power (W) 1.0 70 1.5 1.5 65 2.5 2.0 60 4.0 3.0 58 7.5 4.0 57 12.0 Experiment 3
Team 3 investigated the combined effects of heat sink surface area and airflow rate on CPU temperature using heat sinks with medium fin density. Table 3 shows the CPU temperature (oC) at each surface area and airflow rate.
Table 3.
Surface Area (cm²) 1.5 m/s 3.0 m/s 100 65 61 150 60 58 200 58 57 At a surface area of 100 cm², how does increasing fin density from medium to high affect CPU temperature, and what is the most likely explanation?
CorrectIncorrect -
Question 8 of 40
8. Question
Item 8
Efficient cooling of compact electronic devices requires careful optimization of multiple design variables. In forced-convection systems, heat is removed from a central processing unit (CPU) using a heat sink and airflow generated by a fan. The effectiveness of such systems depends on heat sink surface area, fin density (number of fins per unit width), and airflow rate.
While increasing surface area and airflow generally improves cooling, higher fin density can restrict airflow, and increased airflow requires greater energy consumption. Engineers must therefore balance these competing factors to achieve optimal performance.
Three engineering teams conducted experiments to evaluate these variables for a CPU operating at constant power.
Experiment 1
Team 1 investigated the combined effects of surface area and fin density on CPU temperature at a constant airflow rate of 2.0 m/s. Table 1 shows the CPU temperature (oC) at each surface area and fin density.
Table 1.
Surface Area (cm²) Low Fin Density Medium Fin Density High Fin Density 100 68 64 66 150 63 60 62 200 60 58 59 Experiment 2
Team 2 measured the effect of airflow rate on both temperature and fan power consumption using a heat sink with 150 cm² surface area and medium fin density. The results are displayed in Table 2.
Table 2.
Airflow (m/s) CPU Temperature (oC) Fan Power (W) 1.0 70 1.5 1.5 65 2.5 2.0 60 4.0 3.0 58 7.5 4.0 57 12.0 Experiment 3
Team 3 investigated the combined effects of heat sink surface area and airflow rate on CPU temperature using heat sinks with medium fin density. Table 3 shows the CPU temperature (oC) at each surface area and airflow rate.
Table 3.
Surface Area (cm²) 1.5 m/s 3.0 m/s 100 65 61 150 60 58 200 58 57 Which of the following best describes the relationship between airflow rate and fan power in Table 2?
CorrectIncorrect -
Question 9 of 40
9. Question
Item 9
Efficient cooling of compact electronic devices requires careful optimization of multiple design variables. In forced-convection systems, heat is removed from a central processing unit (CPU) using a heat sink and airflow generated by a fan. The effectiveness of such systems depends on heat sink surface area, fin density (number of fins per unit width), and airflow rate.
While increasing surface area and airflow generally improves cooling, higher fin density can restrict airflow, and increased airflow requires greater energy consumption. Engineers must therefore balance these competing factors to achieve optimal performance.
Three engineering teams conducted experiments to evaluate these variables for a CPU operating at constant power.
Experiment 1
Team 1 investigated the combined effects of surface area and fin density on CPU temperature at a constant airflow rate of 2.0 m/s. Table 1 shows the CPU temperature (oC) at each surface area and fin density.
Table 1.
Surface Area (cm²) Low Fin Density Medium Fin Density High Fin Density 100 68 64 66 150 63 60 62 200 60 58 59 Experiment 2
Team 2 measured the effect of airflow rate on both temperature and fan power consumption using a heat sink with 150 cm² surface area and medium fin density. The results are displayed in Table 2.
Table 2.
Airflow (m/s) CPU Temperature (oC) Fan Power (W) 1.0 70 1.5 1.5 65 2.5 2.0 60 4.0 3.0 58 7.5 4.0 57 12.0 Experiment 3
Team 3 investigated the combined effects of heat sink surface area and airflow rate on CPU temperature using heat sinks with medium fin density. Table 3 shows the CPU temperature (oC) at each surface area and airflow rate.
Table 3.
Surface Area (cm²) 1.5 m/s 3.0 m/s 100 65 61 150 60 58 200 58 57 What is the relationship between temperature drop and surface area when the airflow is increased from 1.5 to 3.0m/s?
CorrectIncorrect -
Question 10 of 40
10. Question
Item 10
Efficient cooling of compact electronic devices requires careful optimization of multiple design variables. In forced-convection systems, heat is removed from a central processing unit (CPU) using a heat sink and airflow generated by a fan. The effectiveness of such systems depends on heat sink surface area, fin density (number of fins per unit width), and airflow rate.
While increasing surface area and airflow generally improves cooling, higher fin density can restrict airflow, and increased airflow requires greater energy consumption. Engineers must therefore balance these competing factors to achieve optimal performance.
Three engineering teams conducted experiments to evaluate these variables for a CPU operating at constant power.
Experiment 1
Team 1 investigated the combined effects of surface area and fin density on CPU temperature at a constant airflow rate of 2.0 m/s. Table 1 shows the CPU temperature (oC) at each surface area and fin density.
Table 1.
Surface Area (cm²) Low Fin Density Medium Fin Density High Fin Density 100 68 64 66 150 63 60 62 200 60 58 59 Experiment 2
Team 2 measured the effect of airflow rate on both temperature and fan power consumption using a heat sink with 150 cm² surface area and medium fin density. The results are displayed in Table 2.
Table 2.
Airflow (m/s) CPU Temperature (oC) Fan Power (W) 1.0 70 1.5 1.5 65 2.5 2.0 60 4.0 3.0 58 7.5 4.0 57 12.0 Experiment 3
Team 3 investigated the combined effects of heat sink surface area and airflow rate on CPU temperature using heat sinks with medium fin density. Table 3 shows the CPU temperature (oC) at each surface area and airflow rate.
Table 3.
Surface Area (cm²) 1.5 m/s 3.0 m/s 100 65 61 150 60 58 200 58 57 Which increase in airflow rate provides the greatest cooling efficiency (temperature decrease per watt)?
CorrectIncorrect -
Question 11 of 40
11. Question
Item 11
Efficient cooling of compact electronic devices requires careful optimization of multiple design variables. In forced-convection systems, heat is removed from a central processing unit (CPU) using a heat sink and airflow generated by a fan. The effectiveness of such systems depends on heat sink surface area, fin density (number of fins per unit width), and airflow rate.
While increasing surface area and airflow generally improves cooling, higher fin density can restrict airflow, and increased airflow requires greater energy consumption. Engineers must therefore balance these competing factors to achieve optimal performance.
Three engineering teams conducted experiments to evaluate these variables for a CPU operating at constant power.
Experiment 1
Team 1 investigated the combined effects of surface area and fin density on CPU temperature at a constant airflow rate of 2.0 m/s. Table 1 shows the CPU temperature (oC) at each surface area and fin density.
Table 1.
Surface Area (cm²) Low Fin Density Medium Fin Density High Fin Density 100 68 64 66 150 63 60 62 200 60 58 59 Experiment 2
Team 2 measured the effect of airflow rate on both temperature and fan power consumption using a heat sink with 150 cm² surface area and medium fin density. The results are displayed in Table 2.
Table 2.
Airflow (m/s) CPU Temperature (oC) Fan Power (W) 1.0 70 1.5 1.5 65 2.5 2.0 60 4.0 3.0 58 7.5 4.0 57 12.0 Experiment 3
Team 3 investigated the combined effects of heat sink surface area and airflow rate on CPU temperature using heat sinks with medium fin density. Table 3 shows the CPU temperature (oC) at each surface area and airflow rate.
Table 3.
Surface Area (cm²) 1.5 m/s 3.0 m/s 100 65 61 150 60 58 200 58 57 Which of the following statements is best supported by the results of the experiments?
CorrectIncorrect -
Question 12 of 40
12. Question
Item 12
Efficient cooling of compact electronic devices requires careful optimization of multiple design variables. In forced-convection systems, heat is removed from a central processing unit (CPU) using a heat sink and airflow generated by a fan. The effectiveness of such systems depends on heat sink surface area, fin density (number of fins per unit width), and airflow rate.
While increasing surface area and airflow generally improves cooling, higher fin density can restrict airflow, and increased airflow requires greater energy consumption. Engineers must therefore balance these competing factors to achieve optimal performance.
Three engineering teams conducted experiments to evaluate these variables for a CPU operating at constant power.
Experiment 1
Team 1 investigated the combined effects of surface area and fin density on CPU temperature at a constant airflow rate of 2.0 m/s. Table 1 shows the CPU temperature (oC) at each surface area and fin density.
Table 1.
Surface Area (cm²) Low Fin Density Medium Fin Density High Fin Density 100 68 64 66 150 63 60 62 200 60 58 59 Experiment 2
Team 2 measured the effect of airflow rate on both temperature and fan power consumption using a heat sink with 150 cm² surface area and medium fin density. The results are displayed in Table 2.
Table 2.
Airflow (m/s) CPU Temperature (oC) Fan Power (W) 1.0 70 1.5 1.5 65 2.5 2.0 60 4.0 3.0 58 7.5 4.0 57 12.0 Experiment 3
Team 3 investigated the combined effects of heat sink surface area and airflow rate on CPU temperature using heat sinks with medium fin density. Table 3 shows the CPU temperature (oC) at each surface area and airflow rate.
Table 3.
Surface Area (cm²) 1.5 m/s 3.0 m/s 100 65 61 150 60 58 200 58 57 A design team chooses a configuration with maximum surface area (200 cm²), high fin density and an airflow rate of 2.0m/s. Which change would most likely produce the greatest additional decrease in CPU temperature?
CorrectIncorrect -
Question 13 of 40
13. Question
Item 13
Populations of many bee species have declined significantly across multiple regions. Bees play a critical role in pollination, so understanding the causes of these declines has become an important area of research. Three scientists present differing perspectives on the most significant factors affecting bee populations.
Scientist 1
Exposure to neonicotinoid pesticides is the primary cause of bee population decline. These chemicals affect the nervous system, impairing navigation and memory, which reduces bees’ ability to forage and return to their hives. Chronic, low-level exposure leads to reduced colony efficiency and can eventually cause collapse. In addition, pesticide exposure can interfere with reproduction by reducing queen fertility and the viability of eggs and larvae. Laboratory studies demonstrate that even sublethal doses of neonicotinoids can alter bee behavior, decrease foraging success, and increase mortality rates. Field observations confirm that colonies in regions with heavy pesticide use exhibit higher rates of decline than those in areas with minimal exposure.
Scientist 2
The primary driver of declining bee populations is the loss of habitat and plant diversity. Bees rely on a variety of flowering plants to obtain balanced nutrition, including proteins, lipids, and essential micronutrients. When natural landscapes are replaced with monoculture crops or urban environments, bees experience nutritional deficiencies that can weaken individuals and colonies over time. Areas with high plant diversity support larger and more stable bee populations, whereas areas dominated by a single crop often see reduced colony survival. Nutritional stress can also reduce bees’ ability to maintain brood and forage efficiently, leading to slower colony growth and increased vulnerability to environmental fluctuations. Observational studies indicate that maintaining or restoring diverse habitats correlates with higher colony survival rates.
Scientist 3
The primary cause of bee population decline is the spread of pathogens and parasites, especially the Varroa mite. These parasites feed on bee bodily fluids, directly weakening individuals, and transmit viruses that spread rapidly within colonies. Infestations often lead to colony collapse within a single season. Experimental studies show that colonies with heavy Varroa infestations experience high mortality even when environmental conditions are favorable and food sources are abundant. Parasites also reduce foraging efficiency and lifespan, disrupt brood development, and compromise immune responses. Observations indicate that regions with widespread parasitic infestations have consistently lower bee population densities, regardless of other environmental variables.
Based on the explanation given by Scientist 1, if bee exposure to neonicotinoid pesticides increased, how would colony reproduction and their ability to return to their hives be affected?
CorrectIncorrect -
Question 14 of 40
14. Question
Item 14
Populations of many bee species have declined significantly across multiple regions. Bees play a critical role in pollination, so understanding the causes of these declines has become an important area of research. Three scientists present differing perspectives on the most significant factors affecting bee populations.
Scientist 1
Exposure to neonicotinoid pesticides is the primary cause of bee population decline. These chemicals affect the nervous system, impairing navigation and memory, which reduces bees’ ability to forage and return to their hives. Chronic, low-level exposure leads to reduced colony efficiency and can eventually cause collapse. In addition, pesticide exposure can interfere with reproduction by reducing queen fertility and the viability of eggs and larvae. Laboratory studies demonstrate that even sublethal doses of neonicotinoids can alter bee behavior, decrease foraging success, and increase mortality rates. Field observations confirm that colonies in regions with heavy pesticide use exhibit higher rates of decline than those in areas with minimal exposure.
Scientist 2
The primary driver of declining bee populations is the loss of habitat and plant diversity. Bees rely on a variety of flowering plants to obtain balanced nutrition, including proteins, lipids, and essential micronutrients. When natural landscapes are replaced with monoculture crops or urban environments, bees experience nutritional deficiencies that can weaken individuals and colonies over time. Areas with high plant diversity support larger and more stable bee populations, whereas areas dominated by a single crop often see reduced colony survival. Nutritional stress can also reduce bees’ ability to maintain brood and forage efficiently, leading to slower colony growth and increased vulnerability to environmental fluctuations. Observational studies indicate that maintaining or restoring diverse habitats correlates with higher colony survival rates.
Scientist 3
The primary cause of bee population decline is the spread of pathogens and parasites, especially the Varroa mite. These parasites feed on bee bodily fluids, directly weakening individuals, and transmit viruses that spread rapidly within colonies. Infestations often lead to colony collapse within a single season. Experimental studies show that colonies with heavy Varroa infestations experience high mortality even when environmental conditions are favorable and food sources are abundant. Parasites also reduce foraging efficiency and lifespan, disrupt brood development, and compromise immune responses. Observations indicate that regions with widespread parasitic infestations have consistently lower bee population densities, regardless of other environmental variables.
Which of the scientists would most likely agree that bee populations can decline even when various food sources are abundant?
CorrectIncorrect -
Question 15 of 40
15. Question
Item 15
Populations of many bee species have declined significantly across multiple regions. Bees play a critical role in pollination, so understanding the causes of these declines has become an important area of research. Three scientists present differing perspectives on the most significant factors affecting bee populations.
Scientist 1
Exposure to neonicotinoid pesticides is the primary cause of bee population decline. These chemicals affect the nervous system, impairing navigation and memory, which reduces bees’ ability to forage and return to their hives. Chronic, low-level exposure leads to reduced colony efficiency and can eventually cause collapse. In addition, pesticide exposure can interfere with reproduction by reducing queen fertility and the viability of eggs and larvae. Laboratory studies demonstrate that even sublethal doses of neonicotinoids can alter bee behavior, decrease foraging success, and increase mortality rates. Field observations confirm that colonies in regions with heavy pesticide use exhibit higher rates of decline than those in areas with minimal exposure.
Scientist 2
The primary driver of declining bee populations is the loss of habitat and plant diversity. Bees rely on a variety of flowering plants to obtain balanced nutrition, including proteins, lipids, and essential micronutrients. When natural landscapes are replaced with monoculture crops or urban environments, bees experience nutritional deficiencies that can weaken individuals and colonies over time. Areas with high plant diversity support larger and more stable bee populations, whereas areas dominated by a single crop often see reduced colony survival. Nutritional stress can also reduce bees’ ability to maintain brood and forage efficiently, leading to slower colony growth and increased vulnerability to environmental fluctuations. Observational studies indicate that maintaining or restoring diverse habitats correlates with higher colony survival rates.
Scientist 3
The primary cause of bee population decline is the spread of pathogens and parasites, especially the Varroa mite. These parasites feed on bee bodily fluids, directly weakening individuals, and transmit viruses that spread rapidly within colonies. Infestations often lead to colony collapse within a single season. Experimental studies show that colonies with heavy Varroa infestations experience high mortality even when environmental conditions are favorable and food sources are abundant. Parasites also reduce foraging efficiency and lifespan, disrupt brood development, and compromise immune responses. Observations indicate that regions with widespread parasitic infestations have consistently lower bee population densities, regardless of other environmental variables.
Based on Scientist 2’s explanation, a decline in bee populations due to nutritional stress would most likely result from which of the following?
CorrectIncorrect -
Question 16 of 40
16. Question
Item 16
Populations of many bee species have declined significantly across multiple regions. Bees play a critical role in pollination, so understanding the causes of these declines has become an important area of research. Three scientists present differing perspectives on the most significant factors affecting bee populations.
Scientist 1
Exposure to neonicotinoid pesticides is the primary cause of bee population decline. These chemicals affect the nervous system, impairing navigation and memory, which reduces bees’ ability to forage and return to their hives. Chronic, low-level exposure leads to reduced colony efficiency and can eventually cause collapse. In addition, pesticide exposure can interfere with reproduction by reducing queen fertility and the viability of eggs and larvae. Laboratory studies demonstrate that even sublethal doses of neonicotinoids can alter bee behavior, decrease foraging success, and increase mortality rates. Field observations confirm that colonies in regions with heavy pesticide use exhibit higher rates of decline than those in areas with minimal exposure.
Scientist 2
The primary driver of declining bee populations is the loss of habitat and plant diversity. Bees rely on a variety of flowering plants to obtain balanced nutrition, including proteins, lipids, and essential micronutrients. When natural landscapes are replaced with monoculture crops or urban environments, bees experience nutritional deficiencies that can weaken individuals and colonies over time. Areas with high plant diversity support larger and more stable bee populations, whereas areas dominated by a single crop often see reduced colony survival. Nutritional stress can also reduce bees’ ability to maintain brood and forage efficiently, leading to slower colony growth and increased vulnerability to environmental fluctuations. Observational studies indicate that maintaining or restoring diverse habitats correlates with higher colony survival rates.
Scientist 3
The primary cause of bee population decline is the spread of pathogens and parasites, especially the Varroa mite. These parasites feed on bee bodily fluids, directly weakening individuals, and transmit viruses that spread rapidly within colonies. Infestations often lead to colony collapse within a single season. Experimental studies show that colonies with heavy Varroa infestations experience high mortality even when environmental conditions are favorable and food sources are abundant. Parasites also reduce foraging efficiency and lifespan, disrupt brood development, and compromise immune responses. Observations indicate that regions with widespread parasitic infestations have consistently lower bee population densities, regardless of other environmental variables.
Suppose a large plot of land is cleared to make room for a series of new subdivisions to be built in an area that was previously a thriving ecosystem for bees. Which scientists would most likely predict the largest decline in bee population as a result of the construction?
CorrectIncorrect -
Question 17 of 40
17. Question
Item 17
Populations of many bee species have declined significantly across multiple regions. Bees play a critical role in pollination, so understanding the causes of these declines has become an important area of research. Three scientists present differing perspectives on the most significant factors affecting bee populations.
Scientist 1
Exposure to neonicotinoid pesticides is the primary cause of bee population decline. These chemicals affect the nervous system, impairing navigation and memory, which reduces bees’ ability to forage and return to their hives. Chronic, low-level exposure leads to reduced colony efficiency and can eventually cause collapse. In addition, pesticide exposure can interfere with reproduction by reducing queen fertility and the viability of eggs and larvae. Laboratory studies demonstrate that even sublethal doses of neonicotinoids can alter bee behavior, decrease foraging success, and increase mortality rates. Field observations confirm that colonies in regions with heavy pesticide use exhibit higher rates of decline than those in areas with minimal exposure.
Scientist 2
The primary driver of declining bee populations is the loss of habitat and plant diversity. Bees rely on a variety of flowering plants to obtain balanced nutrition, including proteins, lipids, and essential micronutrients. When natural landscapes are replaced with monoculture crops or urban environments, bees experience nutritional deficiencies that can weaken individuals and colonies over time. Areas with high plant diversity support larger and more stable bee populations, whereas areas dominated by a single crop often see reduced colony survival. Nutritional stress can also reduce bees’ ability to maintain brood and forage efficiently, leading to slower colony growth and increased vulnerability to environmental fluctuations. Observational studies indicate that maintaining or restoring diverse habitats correlates with higher colony survival rates.
Scientist 3
The primary cause of bee population decline is the spread of pathogens and parasites, especially the Varroa mite. These parasites feed on bee bodily fluids, directly weakening individuals, and transmit viruses that spread rapidly within colonies. Infestations often lead to colony collapse within a single season. Experimental studies show that colonies with heavy Varroa infestations experience high mortality even when environmental conditions are favorable and food sources are abundant. Parasites also reduce foraging efficiency and lifespan, disrupt brood development, and compromise immune responses. Observations indicate that regions with widespread parasitic infestations have consistently lower bee population densities, regardless of other environmental variables.
According to Scientist 3, which of the following processes most directly contributes to rapid colony collapse?
CorrectIncorrect -
Question 18 of 40
18. Question
Item 18
Populations of many bee species have declined significantly across multiple regions. Bees play a critical role in pollination, so understanding the causes of these declines has become an important area of research. Three scientists present differing perspectives on the most significant factors affecting bee populations.
Scientist 1
Exposure to neonicotinoid pesticides is the primary cause of bee population decline. These chemicals affect the nervous system, impairing navigation and memory, which reduces bees’ ability to forage and return to their hives. Chronic, low-level exposure leads to reduced colony efficiency and can eventually cause collapse. In addition, pesticide exposure can interfere with reproduction by reducing queen fertility and the viability of eggs and larvae. Laboratory studies demonstrate that even sublethal doses of neonicotinoids can alter bee behavior, decrease foraging success, and increase mortality rates. Field observations confirm that colonies in regions with heavy pesticide use exhibit higher rates of decline than those in areas with minimal exposure.
Scientist 2
The primary driver of declining bee populations is the loss of habitat and plant diversity. Bees rely on a variety of flowering plants to obtain balanced nutrition, including proteins, lipids, and essential micronutrients. When natural landscapes are replaced with monoculture crops or urban environments, bees experience nutritional deficiencies that can weaken individuals and colonies over time. Areas with high plant diversity support larger and more stable bee populations, whereas areas dominated by a single crop often see reduced colony survival. Nutritional stress can also reduce bees’ ability to maintain brood and forage efficiently, leading to slower colony growth and increased vulnerability to environmental fluctuations. Observational studies indicate that maintaining or restoring diverse habitats correlates with higher colony survival rates.
Scientist 3
The primary cause of bee population decline is the spread of pathogens and parasites, especially the Varroa mite. These parasites feed on bee bodily fluids, directly weakening individuals, and transmit viruses that spread rapidly within colonies. Infestations often lead to colony collapse within a single season. Experimental studies show that colonies with heavy Varroa infestations experience high mortality even when environmental conditions are favorable and food sources are abundant. Parasites also reduce foraging efficiency and lifespan, disrupt brood development, and compromise immune responses. Observations indicate that regions with widespread parasitic infestations have consistently lower bee population densities, regardless of other environmental variables.
A researcher studies four regions with the following conditions:
- Region 1: High pesticide use, high plant diversity, low parasite presence
- Region 2: Low pesticide use, low plant diversity, low parasite presence
- Region 3: Low pesticide use, high plant diversity, high parasite presence
- Region 4: High pesticide use, high plant diversity, high parasite presence
Based on the scientists’ explanations, which region is most likely to experience the largest decline in bee population?
CorrectIncorrect -
Question 19 of 40
19. Question
Item 19
Volcanic eruptions vary depending on magma composition and gas content. Scientists studied 8 volcanoes (Volcanoes A–H) over a 4-month period, measuring silica (SiO₂) content in magma, sulfur dioxide (SO₂) emissions, and eruption frequency.
Table 1 shows the average silica content (% by mass), average daily SO₂ emission (metric tons/day), and total number of eruptions recorded.
Table 1.
Volcano SiO₂ (%) SO₂ (tons/day) Number of Eruptions A 48 110 6 B 52 180 7 C 60 240 9 D 65 310 8 E 70 290 5 F 54 200 10 G 62 260 7 H 68 330 6 Figure 1 shows SO₂ emissions (tons/day) for Volcano D over 8 consecutive days.
Figure 1.
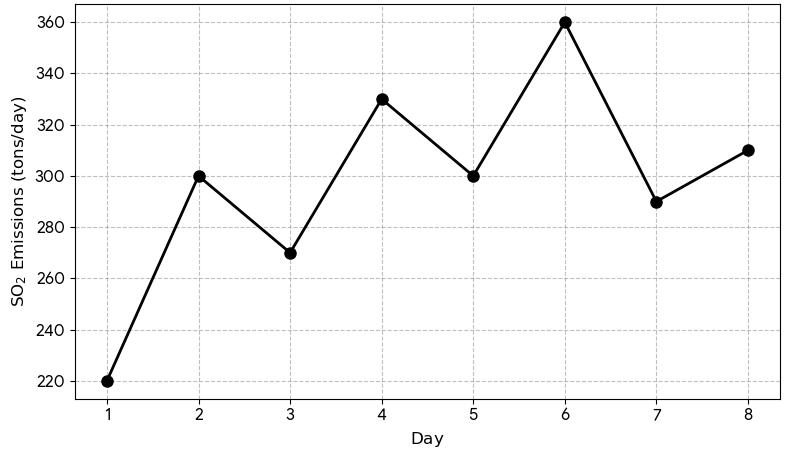
Figure 2 shows the number of eruptions at Volcano D associated with different SO₂ emission ranges.
Figure 2.
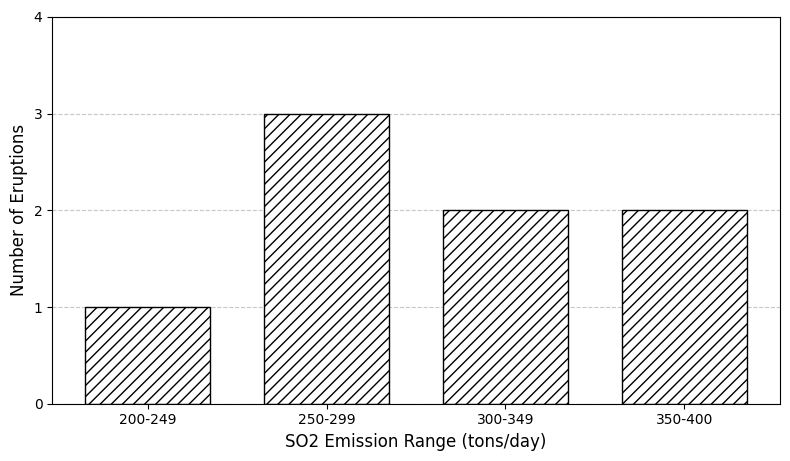
Figure 3 shows the relationship between silica content and eruption style. The primary magma type (basaltic, andesitic, and rhyolitic) involved in each eruption style is shown.
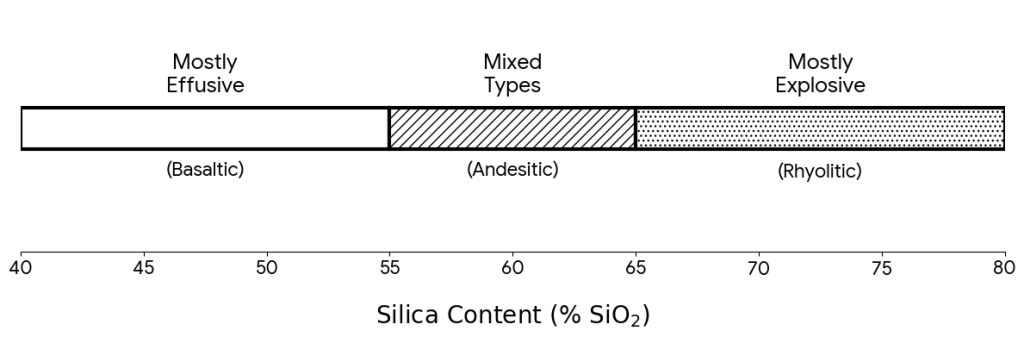
Between which 2 consecutive days did Volcano D experience the greatest increase in SO₂ emissions?
CorrectIncorrect -
Question 20 of 40
20. Question
Item 20
Volcanic eruptions vary depending on magma composition and gas content. Scientists studied 8 volcanoes (Volcanoes A–H) over a 4-month period, measuring silica (SiO₂) content in magma, sulfur dioxide (SO₂) emissions, and eruption frequency.
Table 1 shows the average silica content (% by mass), average daily SO₂ emission (metric tons/day), and total number of eruptions recorded.
Table 1.
Volcano SiO₂ (%) SO₂ (tons/day) Number of Eruptions A 48 110 6 B 52 180 7 C 60 240 9 D 65 310 8 E 70 290 5 F 54 200 10 G 62 260 7 H 68 330 6 Figure 1 shows SO₂ emissions (tons/day) for Volcano D over 8 consecutive days.
Figure 1.
Figure 2 shows the number of eruptions at Volcano D associated with different SO₂ emission ranges.
Figure 2.
Figure 3 shows the relationship between silica content and eruption style. The primary magma type (basaltic, andesitic, and rhyolitic) involved in each eruption style is shown.
Which volcano has the highest average SO2 emission per eruption?
CorrectIncorrect -
Question 21 of 40
21. Question
Item 21
Volcanic eruptions vary depending on magma composition and gas content. Scientists studied 8 volcanoes (Volcanoes A–H) over a 4-month period, measuring silica (SiO₂) content in magma, sulfur dioxide (SO₂) emissions, and eruption frequency.
Table 1 shows the average silica content (% by mass), average daily SO₂ emission (metric tons/day), and total number of eruptions recorded.
Table 1.
Volcano SiO₂ (%) SO₂ (tons/day) Number of Eruptions A 48 110 6 B 52 180 7 C 60 240 9 D 65 310 8 E 70 290 5 F 54 200 10 G 62 260 7 H 68 330 6 Figure 1 shows SO₂ emissions (tons/day) for Volcano D over 8 consecutive days.
Figure 1.
Figure 2 shows the number of eruptions at Volcano D associated with different SO₂ emission ranges.
Figure 2.
Figure 3 shows the relationship between silica content and eruption style. The primary magma type (basaltic, andesitic, and rhyolitic) involved in each eruption style is shown.
Based on the data, what can be concluded about the relationship between the number of days in each emission range and the number of eruptions in that range?
CorrectIncorrect -
Question 22 of 40
22. Question
Item 22
Volcanic eruptions vary depending on magma composition and gas content. Scientists studied 8 volcanoes (Volcanoes A–H) over a 4-month period, measuring silica (SiO₂) content in magma, sulfur dioxide (SO₂) emissions, and eruption frequency.
Table 1 shows the average silica content (% by mass), average daily SO₂ emission (metric tons/day), and total number of eruptions recorded.
Table 1.
Volcano SiO₂ (%) SO₂ (tons/day) Number of Eruptions A 48 110 6 B 52 180 7 C 60 240 9 D 65 310 8 E 70 290 5 F 54 200 10 G 62 260 7 H 68 330 6 Figure 1 shows SO₂ emissions (tons/day) for Volcano D over 8 consecutive days.
Figure 1.
Figure 2 shows the number of eruptions at Volcano D associated with different SO₂ emission ranges.
Figure 2.
Figure 3 shows the relationship between silica content and eruption style. The primary magma type (basaltic, andesitic, and rhyolitic) involved in each eruption style is shown.
Based on the data, which volcano is most likely to produce primarily effusive eruptions?
CorrectIncorrect -
Question 23 of 40
23. Question
Item 23
Volcanic eruptions vary depending on magma composition and gas content. Scientists studied 8 volcanoes (Volcanoes A–H) over a 4-month period, measuring silica (SiO₂) content in magma, sulfur dioxide (SO₂) emissions, and eruption frequency.
Table 1 shows the average silica content (% by mass), average daily SO₂ emission (metric tons/day), and total number of eruptions recorded.
Table 1.
Volcano SiO₂ (%) SO₂ (tons/day) Number of Eruptions A 48 110 6 B 52 180 7 C 60 240 9 D 65 310 8 E 70 290 5 F 54 200 10 G 62 260 7 H 68 330 6 Figure 1 shows SO₂ emissions (tons/day) for Volcano D over 8 consecutive days.
Figure 1.
Figure 2 shows the number of eruptions at Volcano D associated with different SO₂ emission ranges.
Figure 2.
Figure 3 shows the relationship between silica content and eruption style. The primary magma type (basaltic, andesitic, and rhyolitic) involved in each eruption style is shown.
A geologist classifies each volcano observed as basaltic, andesitic, or rhyolitic. Which of the following provides accurate classifications?
CorrectIncorrect -
Question 24 of 40
24. Question
Item 24
Researchers investigated how temperature and predator presence affect the physiology, behavior, and survival of the freshwater zooplankton Daphnia magna. Four studies were conducted.
Study 1
Individual Daphnia were placed at four temperatures. Their average heart rate (bpm) was measured (Table 1).
Table 1.
Temperature (oC) Avg Heart Rate (bpm) 10 118 15 146 20 181 30 239 Study 2
Daphnia were placed in vertical water columns. Trials were conducted with (+P) and without (−P) predator chemical cues. Depth was measured over 3 trials for each condition (Table 2).
Table 2.
Condition Trial 1 (cm) Trial 2 (cm) Trial 3 (cm) -P 6 4 5 +P 16 19 18 Study 3
Groups of Daphnia were exposed to combinations of temperature and predator cues. Percent survival after 7 days is shown (Table 3).
Table 3.
Temperature (oC) -P (%) +P (%) 10 91 86 15 85 74 20 79 61 30 52 21 Study 4
Researchers measured the average number of offspring per individual after 7 days under the same conditions (Table 4).
Table 4.
Temperature (oC) -P Offspring +P Offspring 10 14 12 15 18 15 20 21 16 30 10 6 The average depth of Daphnia with predator chemical cues over Trials 1-3 is closest to:
CorrectIncorrect -
Question 25 of 40
25. Question
Item 25
Researchers investigated how temperature and predator presence affect the physiology, behavior, and survival of the freshwater zooplankton Daphnia magna. Four studies were conducted.
Study 1
Individual Daphnia were placed at four temperatures. Their average heart rate (bpm) was measured (Table 1).
Table 1.
Temperature (oC) Avg Heart Rate (bpm) 10 118 15 146 20 181 30 239 Study 2
Daphnia were placed in vertical water columns. Trials were conducted with (+P) and without (−P) predator chemical cues. Depth was measured over 3 trials for each condition (Table 2).
Table 2.
Condition Trial 1 (cm) Trial 2 (cm) Trial 3 (cm) -P 6 4 5 +P 16 19 18 Study 3
Groups of Daphnia were exposed to combinations of temperature and predator cues. Percent survival after 7 days is shown (Table 3).
Table 3.
Temperature (oC) -P (%) +P (%) 10 91 86 15 85 74 20 79 61 30 52 21 Study 4
Researchers measured the average number of offspring per individual after 7 days under the same conditions (Table 4).
Table 4.
Temperature (oC) -P Offspring +P Offspring 10 14 12 15 18 15 20 21 16 30 10 6 For which temperature is the percent decrease in survival due to predator cues the greatest?
CorrectIncorrect -
Question 26 of 40
26. Question
Item 26
Researchers investigated how temperature and predator presence affect the physiology, behavior, and survival of the freshwater zooplankton Daphnia magna. Four studies were conducted.
Study 1
Individual Daphnia were placed at four temperatures. Their average heart rate (bpm) was measured (Table 1).
Table 1.
Temperature (oC) Avg Heart Rate (bpm) 10 118 15 146 20 181 30 239 Study 2
Daphnia were placed in vertical water columns. Trials were conducted with (+P) and without (−P) predator chemical cues. Depth was measured over 3 trials for each condition (Table 2).
Table 2.
Condition Trial 1 (cm) Trial 2 (cm) Trial 3 (cm) -P 6 4 5 +P 16 19 18 Study 3
Groups of Daphnia were exposed to combinations of temperature and predator cues. Percent survival after 7 days is shown (Table 3).
Table 3.
Temperature (oC) -P (%) +P (%) 10 91 86 15 85 74 20 79 61 30 52 21 Study 4
Researchers measured the average number of offspring per individual after 7 days under the same conditions (Table 4).
Table 4.
Temperature (oC) -P Offspring +P Offspring 10 14 12 15 18 15 20 21 16 30 10 6 A scientist is studying the ideal temperature to reach a minimum Daphnia survival rate of 80% and an offspring production of at least 15 without predator cues. How many different temperatures yielded results that meet these requirements?
CorrectIncorrect -
Question 27 of 40
27. Question
Item 27
Researchers investigated how temperature and predator presence affect the physiology, behavior, and survival of the freshwater zooplankton Daphnia magna. Four studies were conducted.
Study 1
Individual Daphnia were placed at four temperatures. Their average heart rate (bpm) was measured (Table 1).
Table 1.
Temperature (oC) Avg Heart Rate (bpm) 10 118 15 146 20 181 30 239 Study 2
Daphnia were placed in vertical water columns. Trials were conducted with (+P) and without (−P) predator chemical cues. Depth was measured over 3 trials for each condition (Table 2).
Table 2.
Condition Trial 1 (cm) Trial 2 (cm) Trial 3 (cm) -P 6 4 5 +P 16 19 18 Study 3
Groups of Daphnia were exposed to combinations of temperature and predator cues. Percent survival after 7 days is shown (Table 3).
Table 3.
Temperature (oC) -P (%) +P (%) 10 91 86 15 85 74 20 79 61 30 52 21 Study 4
Researchers measured the average number of offspring per individual after 7 days under the same conditions (Table 4).
Table 4.
Temperature (oC) -P Offspring +P Offspring 10 14 12 15 18 15 20 21 16 30 10 6 A student claims that increasing temperature always increases reproductive output. Which of the following observations best disproves this claim?
CorrectIncorrect -
Question 28 of 40
28. Question
Item 28
Researchers investigated how temperature and predator presence affect the physiology, behavior, and survival of the freshwater zooplankton Daphnia magna. Four studies were conducted.
Study 1
Individual Daphnia were placed at four temperatures. Their average heart rate (bpm) was measured (Table 1).
Table 1.
Temperature (oC) Avg Heart Rate (bpm) 10 118 15 146 20 181 30 239 Study 2
Daphnia were placed in vertical water columns. Trials were conducted with (+P) and without (−P) predator chemical cues. Depth was measured over 3 trials for each condition (Table 2).
Table 2.
Condition Trial 1 (cm) Trial 2 (cm) Trial 3 (cm) -P 6 4 5 +P 16 19 18 Study 3
Groups of Daphnia were exposed to combinations of temperature and predator cues. Percent survival after 7 days is shown (Table 3).
Table 3.
Temperature (oC) -P (%) +P (%) 10 91 86 15 85 74 20 79 61 30 52 21 Study 4
Researchers measured the average number of offspring per individual after 7 days under the same conditions (Table 4).
Table 4.
Temperature (oC) -P Offspring +P Offspring 10 14 12 15 18 15 20 21 16 30 10 6 Based on the results of the studies, which of the following statements is best supported?
CorrectIncorrect -
Question 29 of 40
29. Question
Item 29
Researchers investigated how temperature and predator presence affect the physiology, behavior, and survival of the freshwater zooplankton Daphnia magna. Four studies were conducted.
Study 1
Individual Daphnia were placed at four temperatures. Their average heart rate (bpm) was measured (Table 1).
Table 1.
Temperature (oC) Avg Heart Rate (bpm) 10 118 15 146 20 181 30 239 Study 2
Daphnia were placed in vertical water columns. Trials were conducted with (+P) and without (−P) predator chemical cues. Depth was measured over 3 trials for each condition (Table 2).
Table 2.
Condition Trial 1 (cm) Trial 2 (cm) Trial 3 (cm) -P 6 4 5 +P 16 19 18 Study 3
Groups of Daphnia were exposed to combinations of temperature and predator cues. Percent survival after 7 days is shown (Table 3).
Table 3.
Temperature (oC) -P (%) +P (%) 10 91 86 15 85 74 20 79 61 30 52 21 Study 4
Researchers measured the average number of offspring per individual after 7 days under the same conditions (Table 4).
Table 4.
Temperature (oC) -P Offspring +P Offspring 10 14 12 15 18 15 20 21 16 30 10 6 Based on the results of the studies, which condition would most likely produce the greatest overall population growth?
CorrectIncorrect -
Question 30 of 40
30. Question
Item 30
Students studied the motion of charged particles traveling through a region with a uniform electric field. A particle with charge [latex]q[/latex] and mass [latex]m[/latex] enters the field from rest and accelerates over a horizontal distance [latex]d[/latex].
The acceleration is proportional to [latex]\dfrac{qE}{m}[/latex], where [latex]E[/latex] is the electric field strength.
Study 1
The electric field was set to [latex]E=2.0\times 10^3 N/C[/latex], and the distance was [latex]d=0.020 m[/latex]. The results are shown in Table 1.
Table 1.
Trial Particle q/m (C/kg) Time t (ms) Final Speed v (m/s) 1 X [latex]1.0 \times 10^7[/latex] 2.00 20.0 2 Y [latex]2.0 \times 10^7[/latex] 1.41 28.3 3 Z [latex]4.0 \times 10^7[/latex] 1.00 40.0 Study 2
The procedure was repeated with [latex]E=4.0\times 10^3 N/C[/latex], while keeping [latex]d[/latex] constant. The results are shown in Table 2
Table 2.
Trial Particle q/m (C/kg) Time t (ms) Final Speed v (m/s) 4 X [latex]1.0 \times 10^7[/latex] 1.41 28.3 5 Y [latex]2.0 \times 10^7[/latex] 1.00 40.0 6 Z [latex]4.0 \times 10^7[/latex] 0.71 56.6 Study 3
The electric field was reset to [latex]E=2.0\times 10^3 N/C[/latex], but the distance was increased to [latex]d=0.080m[/latex]. The results are shown in Table 3.
Table 3.
Trial Particle q/m (C/kg) Time t (ms) Final Speed v (m/s) 7 X [latex]1.0 \times 10^7[/latex] 4.00 40.0 8 Y [latex]2.0 \times 10^7[/latex] 2.83 56.6 9 Z [latex]4.0 \times 10^7[/latex] 2.00 80.0 The students graphed the final speed [latex]v[/latex] versus [latex]q/m[/latex] for Studies 1 and 2 (see Figure 1).
Figure 1.
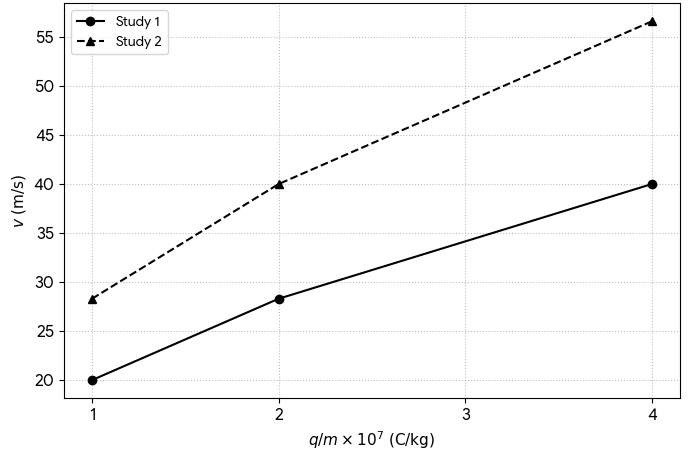
A scientist would like to study whether increasing the distance traveled results in an increase in final speed for the same particle under the same electric field. Which combination of trials would help the scientist figure this out?
CorrectIncorrect -
Question 31 of 40
31. Question
Item 31
Students studied the motion of charged particles traveling through a region with a uniform electric field. A particle with charge [latex]q[/latex] and mass [latex]m[/latex] enters the field from rest and accelerates over a horizontal distance [latex]d[/latex].
The acceleration is proportional to [latex]\dfrac{qE}{m}[/latex], where [latex]E[/latex] is the electric field strength.
Study 1
The electric field was set to [latex]E=2.0\times 10^3 N/C[/latex], and the distance was [latex]d=0.020 m[/latex]. The results are shown in Table 1.
Table 1.
Trial Particle q/m (C/kg) Time t (ms) Final Speed v (m/s) 1 X [latex]1.0 \times 10^7[/latex] 2.00 20.0 2 Y [latex]2.0 \times 10^7[/latex] 1.41 28.3 3 Z [latex]4.0 \times 10^7[/latex] 1.00 40.0 Study 2
The procedure was repeated with [latex]E=4.0\times 10^3 N/C[/latex], while keeping [latex]d[/latex] constant. The results are shown in Table 2
Table 2.
Trial Particle q/m (C/kg) Time t (ms) Final Speed v (m/s) 4 X [latex]1.0 \times 10^7[/latex] 1.41 28.3 5 Y [latex]2.0 \times 10^7[/latex] 1.00 40.0 6 Z [latex]4.0 \times 10^7[/latex] 0.71 56.6 Study 3
The electric field was reset to [latex]E=2.0\times 10^3 N/C[/latex], but the distance was increased to [latex]d=0.080m[/latex]. The results are shown in Table 3.
Table 3.
Trial Particle q/m (C/kg) Time t (ms) Final Speed v (m/s) 7 X [latex]1.0 \times 10^7[/latex] 4.00 40.0 8 Y [latex]2.0 \times 10^7[/latex] 2.83 56.6 9 Z [latex]4.0 \times 10^7[/latex] 2.00 80.0 The students graphed the final speed [latex]v[/latex] versus [latex]q/m[/latex] for Studies 1 and 2 (see Figure 1).
Figure 1.
Which of the following statements best explains why the Study 2 curve lies above the Study 1 curve in Figure 1?
CorrectIncorrect -
Question 32 of 40
32. Question
Item 32
Students studied the motion of charged particles traveling through a region with a uniform electric field. A particle with charge [latex]q[/latex] and mass [latex]m[/latex] enters the field from rest and accelerates over a horizontal distance [latex]d[/latex].
The acceleration is proportional to [latex]\dfrac{qE}{m}[/latex], where [latex]E[/latex] is the electric field strength.
Study 1
The electric field was set to [latex]E=2.0\times 10^3 N/C[/latex], and the distance was [latex]d=0.020 m[/latex]. The results are shown in Table 1.
Table 1.
Trial Particle q/m (C/kg) Time t (ms) Final Speed v (m/s) 1 X [latex]1.0 \times 10^7[/latex] 2.00 20.0 2 Y [latex]2.0 \times 10^7[/latex] 1.41 28.3 3 Z [latex]4.0 \times 10^7[/latex] 1.00 40.0 Study 2
The procedure was repeated with [latex]E=4.0\times 10^3 N/C[/latex], while keeping [latex]d[/latex] constant. The results are shown in Table 2
Table 2.
Trial Particle q/m (C/kg) Time t (ms) Final Speed v (m/s) 4 X [latex]1.0 \times 10^7[/latex] 1.41 28.3 5 Y [latex]2.0 \times 10^7[/latex] 1.00 40.0 6 Z [latex]4.0 \times 10^7[/latex] 0.71 56.6 Study 3
The electric field was reset to [latex]E=2.0\times 10^3 N/C[/latex], but the distance was increased to [latex]d=0.080m[/latex]. The results are shown in Table 3.
Table 3.
Trial Particle q/m (C/kg) Time t (ms) Final Speed v (m/s) 7 X [latex]1.0 \times 10^7[/latex] 4.00 40.0 8 Y [latex]2.0 \times 10^7[/latex] 2.83 56.6 9 Z [latex]4.0 \times 10^7[/latex] 2.00 80.0 The students graphed the final speed [latex]v[/latex] versus [latex]q/m[/latex] for Studies 1 and 2 (see Figure 1).
Figure 1.
Which of the following best describes the relationship between final speed v and q/m?
CorrectIncorrect -
Question 33 of 40
33. Question
Item 33
Students studied the motion of charged particles traveling through a region with a uniform electric field. A particle with charge [latex]q[/latex] and mass [latex]m[/latex] enters the field from rest and accelerates over a horizontal distance [latex]d[/latex].
The acceleration is proportional to [latex]\dfrac{qE}{m}[/latex], where [latex]E[/latex] is the electric field strength.
Study 1
The electric field was set to [latex]E=2.0\times 10^3 N/C[/latex], and the distance was [latex]d=0.020 m[/latex]. The results are shown in Table 1.
Table 1.
Trial Particle q/m (C/kg) Time t (ms) Final Speed v (m/s) 1 X [latex]1.0 \times 10^7[/latex] 2.00 20.0 2 Y [latex]2.0 \times 10^7[/latex] 1.41 28.3 3 Z [latex]4.0 \times 10^7[/latex] 1.00 40.0 Study 2
The procedure was repeated with [latex]E=4.0\times 10^3 N/C[/latex], while keeping [latex]d[/latex] constant. The results are shown in Table 2
Table 2.
Trial Particle q/m (C/kg) Time t (ms) Final Speed v (m/s) 4 X [latex]1.0 \times 10^7[/latex] 1.41 28.3 5 Y [latex]2.0 \times 10^7[/latex] 1.00 40.0 6 Z [latex]4.0 \times 10^7[/latex] 0.71 56.6 Study 3
The electric field was reset to [latex]E=2.0\times 10^3 N/C[/latex], but the distance was increased to [latex]d=0.080m[/latex]. The results are shown in Table 3.
Table 3.
Trial Particle q/m (C/kg) Time t (ms) Final Speed v (m/s) 7 X [latex]1.0 \times 10^7[/latex] 4.00 40.0 8 Y [latex]2.0 \times 10^7[/latex] 2.83 56.6 9 Z [latex]4.0 \times 10^7[/latex] 2.00 80.0 The students graphed the final speed [latex]v[/latex] versus [latex]q/m[/latex] for Studies 1 and 2 (see Figure 1).
Figure 1.
What is the acceleration of Particle Y in Study 3?
CorrectIncorrect -
Question 34 of 40
34. Question
Item 34
Students studied the motion of charged particles traveling through a region with a uniform electric field. A particle with charge [latex]q[/latex] and mass [latex]m[/latex] enters the field from rest and accelerates over a horizontal distance [latex]d[/latex].
The acceleration is proportional to [latex]\dfrac{qE}{m}[/latex], where [latex]E[/latex] is the electric field strength.
Study 1
The electric field was set to [latex]E=2.0\times 10^3 N/C[/latex], and the distance was [latex]d=0.020 m[/latex]. The results are shown in Table 1.
Table 1.
Trial Particle q/m (C/kg) Time t (ms) Final Speed v (m/s) 1 X [latex]1.0 \times 10^7[/latex] 2.00 20.0 2 Y [latex]2.0 \times 10^7[/latex] 1.41 28.3 3 Z [latex]4.0 \times 10^7[/latex] 1.00 40.0 Study 2
The procedure was repeated with [latex]E=4.0\times 10^3 N/C[/latex], while keeping [latex]d[/latex] constant. The results are shown in Table 2
Table 2.
Trial Particle q/m (C/kg) Time t (ms) Final Speed v (m/s) 4 X [latex]1.0 \times 10^7[/latex] 1.41 28.3 5 Y [latex]2.0 \times 10^7[/latex] 1.00 40.0 6 Z [latex]4.0 \times 10^7[/latex] 0.71 56.6 Study 3
The electric field was reset to [latex]E=2.0\times 10^3 N/C[/latex], but the distance was increased to [latex]d=0.080m[/latex]. The results are shown in Table 3.
Table 3.
Trial Particle q/m (C/kg) Time t (ms) Final Speed v (m/s) 7 X [latex]1.0 \times 10^7[/latex] 4.00 40.0 8 Y [latex]2.0 \times 10^7[/latex] 2.83 56.6 9 Z [latex]4.0 \times 10^7[/latex] 2.00 80.0 The students graphed the final speed [latex]v[/latex] versus [latex]q/m[/latex] for Studies 1 and 2 (see Figure 1).
Figure 1.
A new particle W has q/m = 3.0 x 10⁷ C/kg. Under Study 2 conditions, its final speed would most likely be closest to:
CorrectIncorrect -
Question 35 of 40
35. Question
Item 35
Students studied the motion of charged particles traveling through a region with a uniform electric field. A particle with charge [latex]q[/latex] and mass [latex]m[/latex] enters the field from rest and accelerates over a horizontal distance [latex]d[/latex].
The acceleration is proportional to [latex]\dfrac{qE}{m}[/latex], where [latex]E[/latex] is the electric field strength.
Study 1
The electric field was set to [latex]E=2.0\times 10^3 N/C[/latex], and the distance was [latex]d=0.020 m[/latex]. The results are shown in Table 1.
Table 1.
Trial Particle q/m (C/kg) Time t (ms) Final Speed v (m/s) 1 X [latex]1.0 \times 10^7[/latex] 2.00 20.0 2 Y [latex]2.0 \times 10^7[/latex] 1.41 28.3 3 Z [latex]4.0 \times 10^7[/latex] 1.00 40.0 Study 2
The procedure was repeated with [latex]E=4.0\times 10^3 N/C[/latex], while keeping [latex]d[/latex] constant. The results are shown in Table 2
Table 2.
Trial Particle q/m (C/kg) Time t (ms) Final Speed v (m/s) 4 X [latex]1.0 \times 10^7[/latex] 1.41 28.3 5 Y [latex]2.0 \times 10^7[/latex] 1.00 40.0 6 Z [latex]4.0 \times 10^7[/latex] 0.71 56.6 Study 3
The electric field was reset to [latex]E=2.0\times 10^3 N/C[/latex], but the distance was increased to [latex]d=0.080m[/latex]. The results are shown in Table 3.
Table 3.
Trial Particle q/m (C/kg) Time t (ms) Final Speed v (m/s) 7 X [latex]1.0 \times 10^7[/latex] 4.00 40.0 8 Y [latex]2.0 \times 10^7[/latex] 2.83 56.6 9 Z [latex]4.0 \times 10^7[/latex] 2.00 80.0 The students graphed the final speed [latex]v[/latex] versus [latex]q/m[/latex] for Studies 1 and 2 (see Figure 1).
Figure 1.
Scientists are studying two new particles, Particle U and Particle V. The mass of Particle U is 2.0 x 10⁻²⁶ kg and the mass of particle V is 1.0 x 10⁻²⁶ kg. Suppose Particle U is placed under the conditions of Study 2 and Particle V is placed under the conditions of Study 1. Both particles have the same charge q.
Compared to the acceleration of Particle V, the acceleration of Particle U is:
CorrectIncorrect -
Question 36 of 40
36. Question
Item 36
Students conducted an experiment to see how much of a solid “precipitates” (falls out of solution as a solid) when a hot solution is cooled. They added specific masses of four salts (Potassium Nitrate, KNO3; Sodium Chloride, NaCl; Lead(II) Nitrate, Pb(NO3)2; and Cerium(III)Sulfate, Ce2(SO4)3) to 100g of H2O at 100oC, ensuring they were fully dissolved. Then, they cooled the solutions to the temperatures listed in Table 1 and measured the mass of the solid that precipitated.
Table 1.
Trial Salt Mass Added at 100oC (g) Final Temp (oC) Mass of Precipitate (g) 1 KNO3 150 60 45 2 KNO3 150 20 118 3 NaCl 40 20 4 4 Pb(NO3)2 100 60 10 5 Pb(NO3)2 100 20 46 6 Ce2(SO4)3 15 80 13 Solubility is the maximum amount of a substance (solute) that can dissolve in a specific amount of solvent (usually water) at a given temperature. Figure 1 shows the solubility of the same four salts in water at temperatures ranging from 0oC to 100oC.
Figure 1.
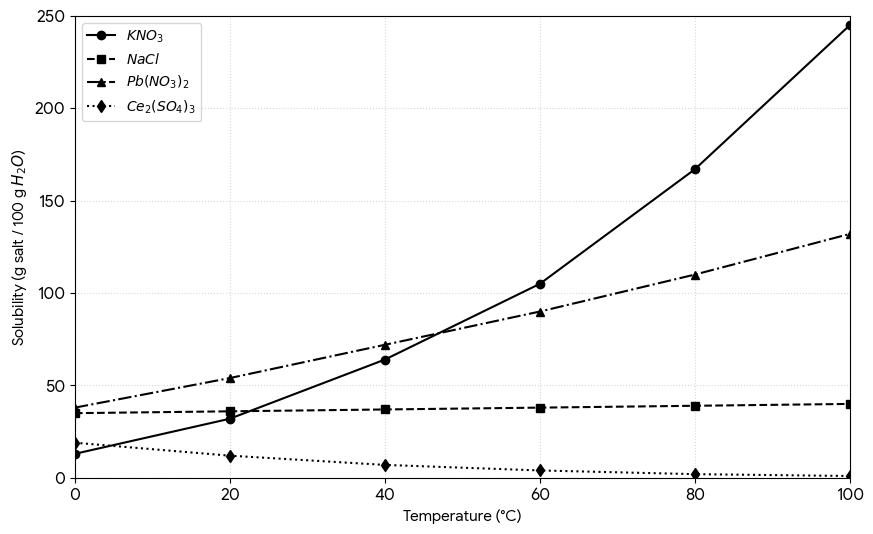
At which of the following temperatures is the solubility of KNO3 closest to the solubility of NaCl?
CorrectIncorrect -
Question 37 of 40
37. Question
Item 37
Students conducted an experiment to see how much of a solid “precipitates” (falls out of solution as a solid) when a hot solution is cooled. They added specific masses of four salts (Potassium Nitrate, KNO3; Sodium Chloride, NaCl; Lead(II) Nitrate, Pb(NO3)2; and Cerium(III)Sulfate, Ce2(SO4)3) to 100g of H2O at 100oC, ensuring they were fully dissolved. Then, they cooled the solutions to the temperatures listed in Table 1 and measured the mass of the solid that precipitated.
Table 1.
Trial Salt Mass Added at 100oC (g) Final Temp (oC) Mass of Precipitate (g) 1 KNO3 150 60 45 2 KNO3 150 20 118 3 NaCl 40 20 4 4 Pb(NO3)2 100 60 10 5 Pb(NO3)2 100 20 46 6 Ce2(SO4)3 15 80 13 Solubility is the maximum amount of a substance (solute) that can dissolve in a specific amount of solvent (usually water) at a given temperature. Figure 1 shows the solubility of the same four salts in water at temperatures ranging from 0oC to 100oC.
Figure 1.
The maximum amount of KNO3 in Trial 1 that could remain dissolved in 100g of water at 60oC was:
CorrectIncorrect -
Question 38 of 40
38. Question
Item 38
Students conducted an experiment to see how much of a solid “precipitates” (falls out of solution as a solid) when a hot solution is cooled. They added specific masses of four salts (Potassium Nitrate, KNO3; Sodium Chloride, NaCl; Lead(II) Nitrate, Pb(NO3)2; and Cerium(III)Sulfate, Ce2(SO4)3) to 100g of H2O at 100oC, ensuring they were fully dissolved. Then, they cooled the solutions to the temperatures listed in Table 1 and measured the mass of the solid that precipitated.
Table 1.
Trial Salt Mass Added at 100oC (g) Final Temp (oC) Mass of Precipitate (g) 1 KNO3 150 60 45 2 KNO3 150 20 118 3 NaCl 40 20 4 4 Pb(NO3)2 100 60 10 5 Pb(NO3)2 100 20 46 6 Ce2(SO4)3 15 80 13 Solubility is the maximum amount of a substance (solute) that can dissolve in a specific amount of solvent (usually water) at a given temperature. Figure 1 shows the solubility of the same four salts in water at temperatures ranging from 0oC to 100oC.
Figure 1.
If the student had cooled the solution in Trial 4 to 80oC instead of 60oC, the mass of the precipitate would have been closest to:
CorrectIncorrect -
Question 39 of 40
39. Question
Item 39
Students conducted an experiment to see how much of a solid “precipitates” (falls out of solution as a solid) when a hot solution is cooled. They added specific masses of four salts (Potassium Nitrate, KNO3; Sodium Chloride, NaCl; Lead(II) Nitrate, Pb(NO3)2; and Cerium(III)Sulfate, Ce2(SO4)3) to 100g of H2O at 100oC, ensuring they were fully dissolved. Then, they cooled the solutions to the temperatures listed in Table 1 and measured the mass of the solid that precipitated.
Table 1.
Trial Salt Mass Added at 100oC (g) Final Temp (oC) Mass of Precipitate (g) 1 KNO3 150 60 45 2 KNO3 150 20 118 3 NaCl 40 20 4 4 Pb(NO3)2 100 60 10 5 Pb(NO3)2 100 20 46 6 Ce2(SO4)3 15 80 13 Solubility is the maximum amount of a substance (solute) that can dissolve in a specific amount of solvent (usually water) at a given temperature. Figure 1 shows the solubility of the same four salts in water at temperatures ranging from 0oC to 100oC.
Figure 1.
A scientist conducted Trial 7, adding 40g of NaCl at 100oC and cooling it to 40oC. The amount dissolved after cooling is expected to be closest to:
CorrectIncorrect -
Question 40 of 40
40. Question
Item 40
Students conducted an experiment to see how much of a solid “precipitates” (falls out of solution as a solid) when a hot solution is cooled. They added specific masses of four salts (Potassium Nitrate, KNO3; Sodium Chloride, NaCl; Lead(II) Nitrate, Pb(NO3)2; and Cerium(III)Sulfate, Ce2(SO4)3) to 100g of H2O at 100oC, ensuring they were fully dissolved. Then, they cooled the solutions to the temperatures listed in Table 1 and measured the mass of the solid that precipitated.
Table 1.
Trial Salt Mass Added at 100oC (g) Final Temp (oC) Mass of Precipitate (g) 1 KNO3 150 60 45 2 KNO3 150 20 118 3 NaCl 40 20 4 4 Pb(NO3)2 100 60 10 5 Pb(NO3)2 100 20 46 6 Ce2(SO4)3 15 80 13 Solubility is the maximum amount of a substance (solute) that can dissolve in a specific amount of solvent (usually water) at a given temperature. Figure 1 shows the solubility of the same four salts in water at temperatures ranging from 0oC to 100oC.
Figure 1.
In Trial 6, Ce2(SO4)3 was cooled to 80oC. Suppose a scientist cooled the solution further to 20oC. Compared to Trial 6, would the scientist expect to see a larger mass of precipitate or a smaller mass and why?
CorrectIncorrect